
7 Important Income Statement Ratios And How To Use Them
In this tutorial, I’ll teach you 7 important income statement ratios that you need to know when analyzing an income statement. These ratios are widely used by large institutional investors to small retail investors. Many businesses are now letting a specialized team handle management, from anything to marketing, sales to analytics. Companies that offer these services and more like Salesforce are a major part in today’s business dynamic.
I learned all of this stuff on the book by Mary Buffett and David Clark, Warren Buffett and the Interpretation of Financial Statements and I’m excited to share this knowledge to you.
At the end of this post, you’ll learn how to use and apply them in your stock valuations.
So let’s get started.
The 7 Income Statement Ratios And How To Use Them
From the Income Statement, we’ll derive each of the 7 important Income Statement ratios which are as follows;
- Gross Profit Margin
- Operating Profit Margin
- Net Profit Margin
- Selling, General & Administration to Gross Profit
- Depreciation to Gross Profit
- Research & Development to Gross Profit
- Interest Expense to Operating Profit
So first on the list, we have the Gross Profit Margin.
#1 Gross Profit Margin
Gross Profit is the money made by a company after all the costs of raw goods and materials are subtracted from the Revenue. If you divide it by the Revenue, we get the Gross Profit Margin; a ratio that tells us how much Gross Profit is made for every one peso of Revenue.
The formula for Gross Profit Margin is;
Where:
To illustrate, if a company’s Revenue is Php 100 and the Gross Profit is Php 50, we get a margin of 50% which means that the company made 50 centavos of Gross Profit for every 1 peso of Revenue.
Some Income Statements shows how much Gross Profit a company has made. Consider this example of Puregold’s (PGOLD) Income Statement below.
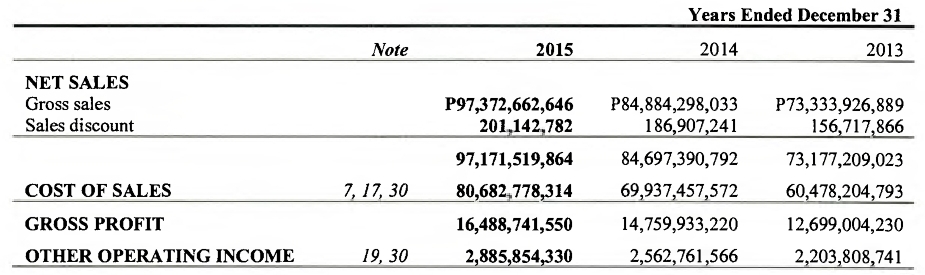
Fig. 1 PGOLD’s Net Sales, Cost of Sales and Gross Profit
It’s clearly shown that the Gross Profit in 2015 is Php 16,488,741,550 while Revenue is Php 97,372,662,646. If you subtract the Sales Discount in the Revenue, you’ll get Net Revenue (Net Sales) which is Php 97,171,519,864.
The Cost Of Revenue (Cost Of Sales) is also shown here as Php 80,682,778,314. If you want to determine the components of this item, you should proceed by looking at notes 7, 17 and 30 of the annual report. Note 17 explains what the figure is composed of as seen below.
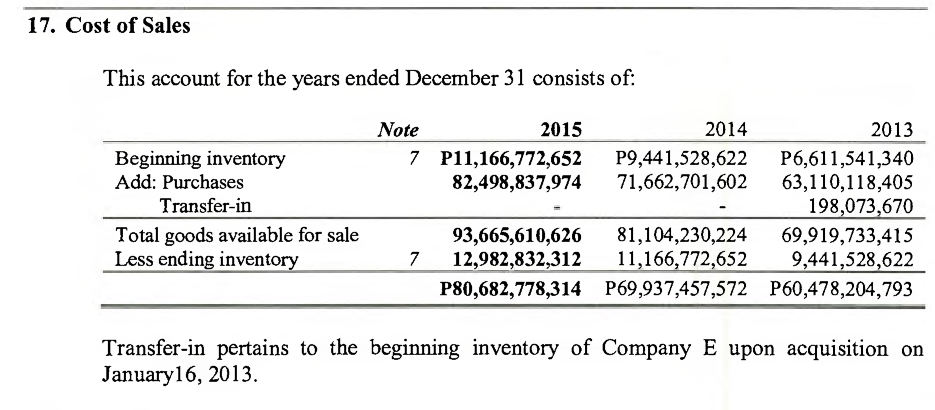
Fig. 2 PGOLD’s Note 17 (Cost Of Sales)
The Gross Profit Margin in this example is;
Gross Profit Margin % = 16.97%
Sometimes, there are times when the Gross Profit isn’t shown. If that’s the case, we have to calculate it manually. Consider Megaworld Corporation’s (MEG) Income Statement as an example.
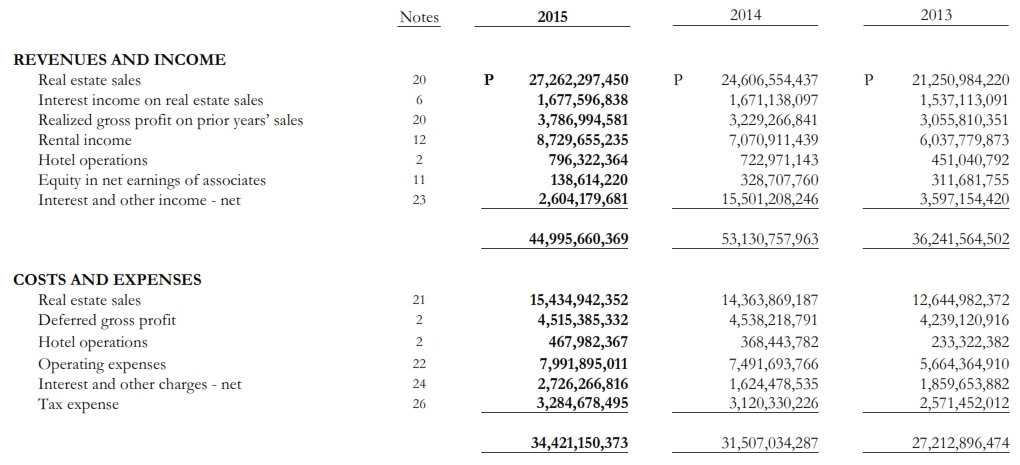
Fig. 3 Income Statement w/o Gross Profit listed
To calculate the Gross Profit, we need to identify the Total Revenue and exclude the Non-recurring/Non-operating Income and Interest Income. In the above example, we exclude the Equity In Net Earnings Of Associates and Interest And Other Income – Net. The rest when added, is the Total Revenue.
So let’s calculate the figures for the year 2015;
Total Revenue = Php 42,252,866,468
The second thing we need to do is to identify the items that can be included in the Cost Of Sales.
The Cost And Expenses lists items such as Real Estate Sales, Deferred Gross Profit and Hotel Operations which when added, is the total Cost Of Sales.
Let’s add the items;
Cost Of Sales = Php 20,418,310,051
Now we can calculate the Gross Profit;
Gross Profit = Php 21,834,556,417
With these data, we now calculate the Gross Profit Margin;
Gross Profit Margin % = 51.67%
In my case, a ratio of above 30% is good enough for me.
#2 Operating Profit Margin
Operating Profit is Gross Profit minus the Operating Expenses. If divided by the Revenue, we get the Operating Profit Margin which tells us how much Operating Profit is made for every one peso of Revenue.
Here’s the formula;
Where;
Consider PGOLD’s example below.
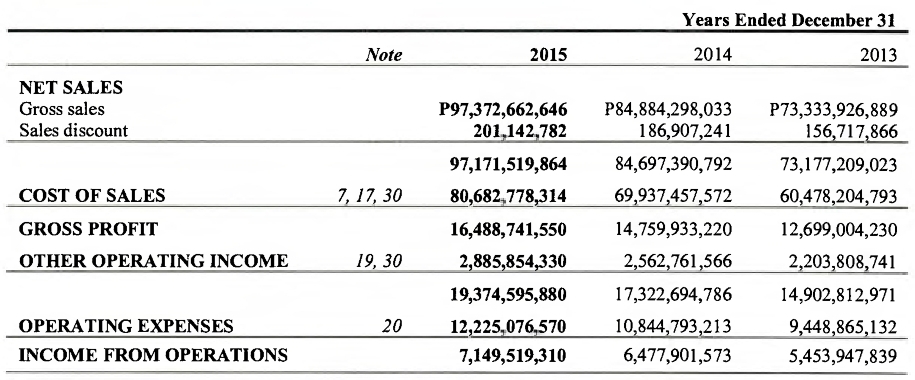
Fig. 4 PGOLD’s Operating Profit
It is shown that the Operating Profit (Income From Operations) in 2015 is Php 7,149,519,310. To understand the figure better, we should determine the Operating Expenses that the company incurred.
Let’s look at Note 20.
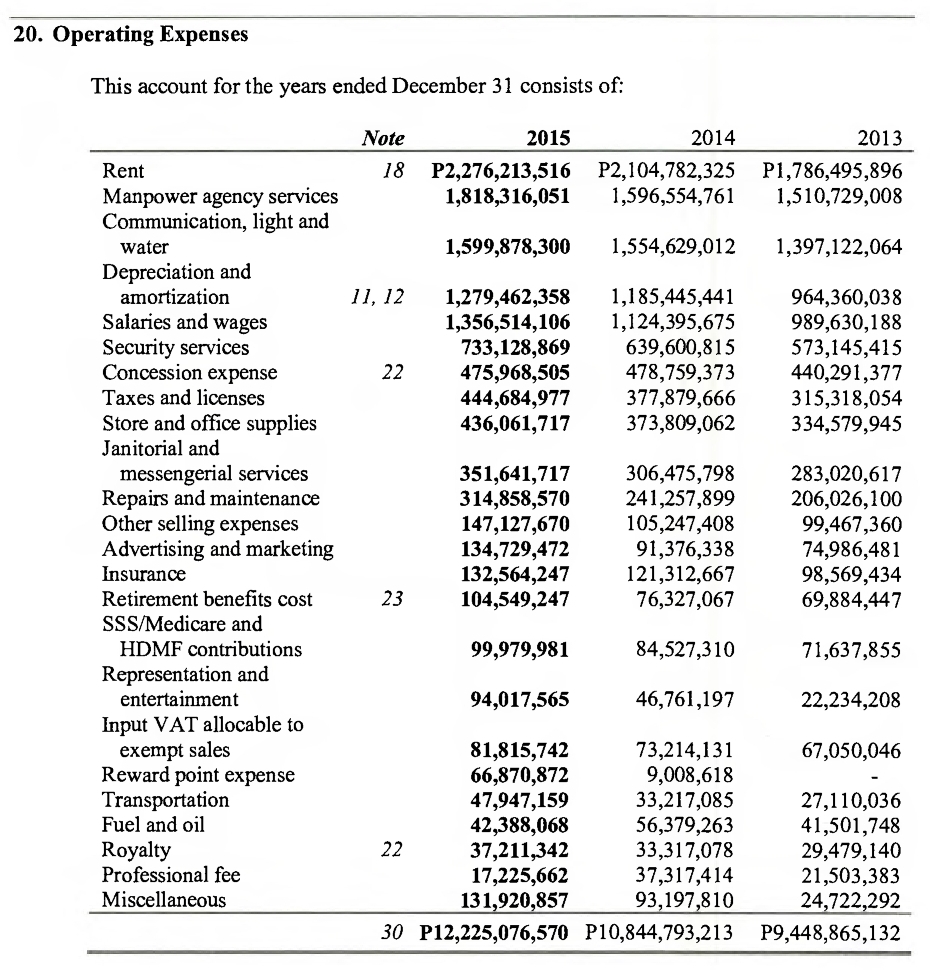
Fig. 5 PGOLD’s Note 20 (Operating Expenses)
You can see from this section all the Operating Expenses the company made. By looking at the figures on each of the line items, you can see where the company spends the most.
In this example, it is evident that in 2015, PGOLD has spent a lot on Rent and Manpower Agency Services.
It is also shown that the company made money through other operations as listed in the entry Other Operating Income. Let’s see what kind of income is this on note 19.
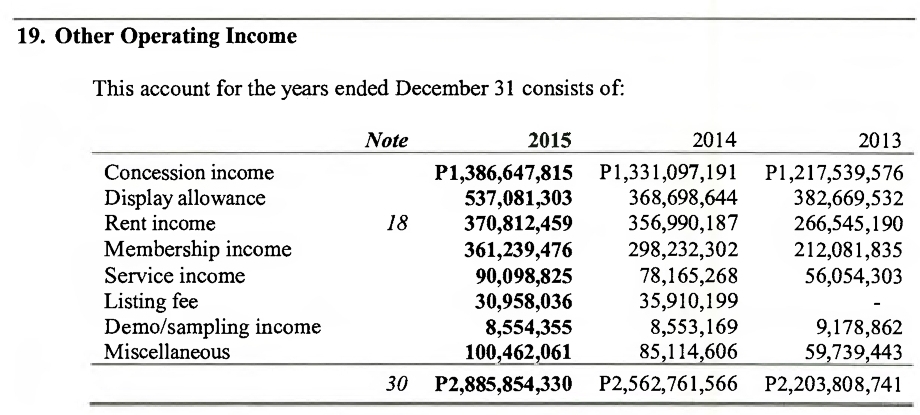
Fig. 6 PGOLD’s Note 19 Other Operating Income
In this example, the company made most of its Other Operating Income through Concession Income.
The point of looking at these figures is to better understand the other income generation models the company is utilizing besides their main business model.
Okay, so let’s head on to the calculations. We have determined all of the variables and confirmed them by looking at the notes. We now apply the formulas;
Operating Profit = Php 16,488,741,550 + Php 2,885,854,330 – Php 12,225,076,570
Operating Profit = Php 7,149,519,310
The Operating Profit Margin would be;
Operating Profit Margin % = 7.36%
Now if the Operating Profit is not listed as in the case of Fig. 3, then we should calculate it manually.
We had already calculated the Gross Profit to be Php 21,834,556,417. The Operating Expenses listed in the Income Statement amounts to Php 7,991,895,011.
Applying the formula for the Operating Profit;
Operating Profit = Php 13,842,661,406
Now for the Operating Profit Margin;
Operating Profit Margin % = 32.76%
As a rule, OPMs equal to or above 20% are companies that do well. I’m more likely to be interested in stocks that meets this benchmark.
#3 Net Profit Margin
Net Profit Margin is a financial ratio that tells us how much income is made for every one peso of Revenue. This is also one of my favorite ratios because of its simplicity. By looking at this ratio, we can quickly tell how much the company earned within the year.
To illustrate, a company with a Net Profit Margin of 20% means that the company made 20 centavos of profit for every one peso of sales.
Here’s the formula.
This is one of the most easiest and straightforward ratios that you can calculate because you would only need to look at the top and bottom figures of the Income Statement.
Let’s take a look again at PGOLD.
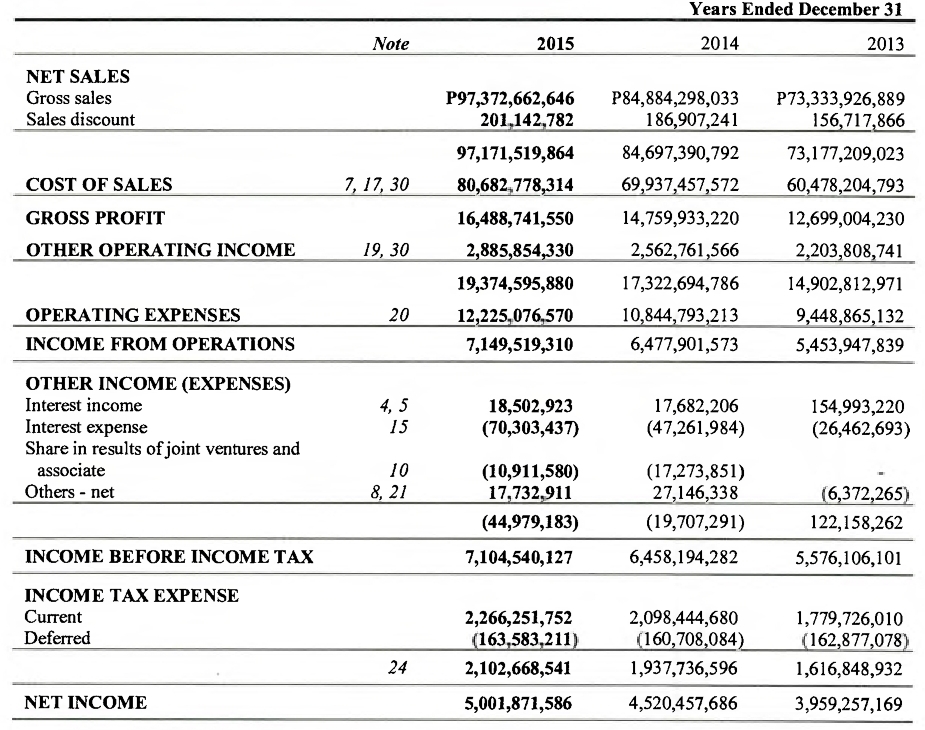
Fig. 7 PGOLD’s Income Statement
Net Profit Margin for 2015 is calculated as follows;
Net Profit Margin % = 5.15%
This ratio means that the company made Php 0.0515 centavos for every one peso of Revenue.
As my personal rule, I look for businesses that has NPMs above 15%.
#4 Selling, General & Administration To Gross Profit
The formula for this ratio is shown below.
The importance of getting this ratio is to know how much SG&A Costs the company is spending relative to their Gross Profit. Normally, we want a business with low SG&A costs to maximize profits. That’s the purpose of this ratio.
The tricky part is looking for the SG&A Expenses because not all Income Statements display this figure.
Here’s a simple formula that you can use to calculate the SG&A Expenses.
To demonstrate the formula, refer back to Fig. 5. To get the SG&A Expenses for 2015, we need to exclude the Depreciation & Amortization Costs and Research & Development Costs.
In the example, we only need to remove the D&A Costs since the R&D Costs is not included.
Let’s now calculate the SG&A Expenses.
SG&A Expenses = Php 10,945,614,212
Now that we got the SG&A Expenses, we now calculate the SG&A to Gross Profit Margin.
SG&A to GP % = 66.38%
Let’s take another example. We’ll again use MEG’s Income Statement. Let’s go back to Fig. 3.
There’s a line in there that says Operating Expenses. To see what it contains, we refer to Note 22. Let’s see what that section contains.
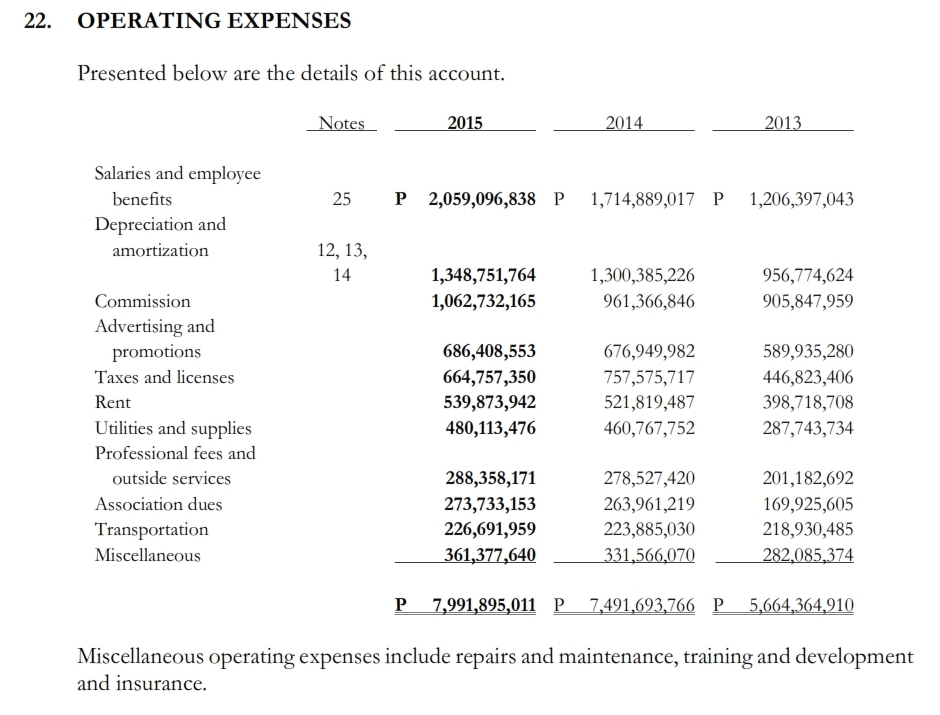
Fig. 8 MEG’s Note 22 Operating Expenses
Just like the previous example, we need to separate the D&A and the R&D costs in the Operating Expenses.
Applying the formula;
SG&A Expenses = Php 6,643,143,247
For the SG&A to GP %;
SG&A to GP % = 30.42%
I use the same ratio in determining my stock picks.
#5 Depreciation & Amortization To Gross Profit
Now why do we need to get the ratio between Depreciation & Amortization to Gross Profit? According to Warren Buffett, Depreciation is a real expense because any equipment will eventually wear out within its life span and be replaced. That’s the reason why we should learn to understand its effects on a company’s profitability.
Here’s the formula.
Some Income Statements lists D&A Expenses like this one from Now Corporation (NOW).
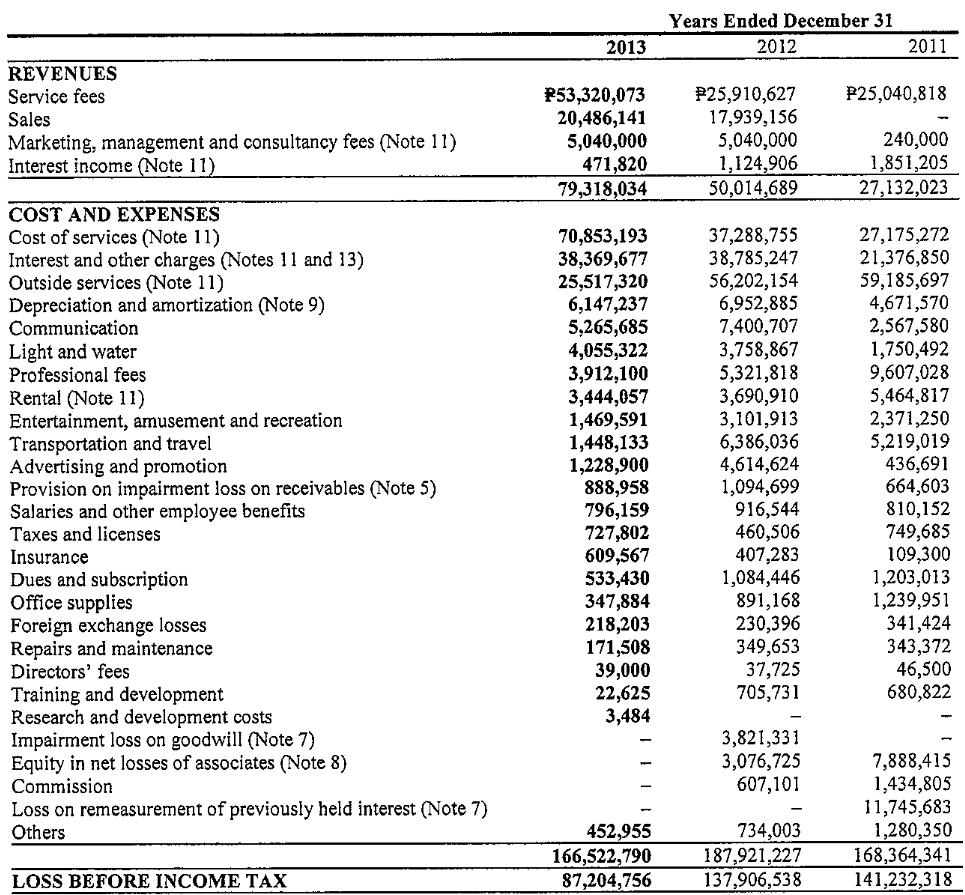
Fig. 9 NOW’s Income Statement
If this is the case, then you can calculate the D&A to GP by taking out the figures and applying the formula.
Here’s the calculation;
Revenue = Php 78,846,214
Cost Of Revenue = Php 70,853,193; (Cost Of Sales)
Gross Profit = Php 78,846,214 – Php 70,853,193
Gross Profit = Php 7,993,021
D&A to GP % = (Php 6,147,237 / Php 7,993,021) x 100
D&A to GP % = 76.90%
Most Income Statements don’t list D&A Expenses outright. To get this value, we need to calculate it.
Let’s again go back to Fig. 5.
As you noticed, there’s a line item in PGOLD’s Operating Expenses that says Depreciation & Amortization. That’s the number that we are looking at. We get that number and apply it to our formula.
D&A to GP % = 7.76%
As my rule, I look for D&A to GP ratios below 10%.
#6 Research & Development To Gross Profit
Warren Buffett mentions that the threat of a newer technology tends to put the long-term economics of a company at a risk. It’s for this reason that a company will spend high on R&D Expenses to maintain its competitive advantage. But if it fails, a company’s product or service may end up obsolete overnight. The importance of this ratio is to know exactly how much R&D Expenses is spent relative to Gross Profit.
The formula is this;
Most companies do not have R&D Costs. But some, especially tech companies has this type of expense because these types of industries rely on updated technological advances.
Referring to Fig. 9, NOW’s R&D cost (R&D + Training & Dev’t) in 2013 amounts to Php 26,109.
Let’s calculate;
R&D to GP % = 0.33%
In my case, I love it when it’s zero.
#7 Interest Expense To Operating Profit
Companies borrow money for a number of reasons. One reason is to fund capital expenditures. The other is when a company buys another company through a leveraged buyout.
The debt that the company carries on its books incurs interest which is then paid during the year. The logic is simple; more debt equals more interests to pay.
This ratio will tell us how much Interest a company pays in relation to its Operating Profits.
The formula for Interest Expense to Operating Profit is this;
To illustrate, let’s look at the previous example, Fig. 7.
You’ll notice that we can directly apply the formula. We’ll just pick up the figures for PGOLD’s Interest Expense in 2015 amounting to Php 70,303,437.
Let’s apply the formula.
IE to OI % = 0.98%
In my valuations, I look for a much lower ratio, like around 10%.
Final Thoughts
These 7 Income Statement ratios are very important in determining if a company has the ability to sustain its income for the long-term. I’ve discussed these ratios in simple detail to teach you exactly how you can calculate and interpret these numbers.
With that said, I encourage you to look at the Income Statements of your investments, practice calculating these ratios and try to understand and interpret them on your own.
For my next tutorial, I’ll discuss about how I use the P/E, P/BV and the Graham Ratio as popularized by Benjamin Graham in his book The Intelligent Investor in screening which stocks are worthy to dive into.
If you have any questions and clarifications in the materials I presented in this post, kindly leave your comment below. Let’s learn from each other.
Happy investing!
Thank you Sir! Very helpful and it is presented very well. Keep it up! God bless!
You’re welcome Jefferson. 🙂
Great and informative article. Thank you for this bro. Keep it up. I’m learning from you.
You’re welcome bro. More to come! 🙂
GREAT READ! GOD BLESS YOU!