Intrinsic Value Calculation: SM, SMPH, ALI for FY2017

Hey investizen!
This post will discuss SM, SMPH and ALI. You may check back at this post for the intrinsic value calculations I did based on the annual reports released and data from Morningstar.
If you want to find professional recommendations, I encourage you to subscribe at PinoyInvestor.
Just to give you an overview of my stock picking operations, I look for companies with consistent profits, high returns on equity and capital, low debt, lots of free cash flow and promising future prospects. I use a fair value multiple to determine the intrinsic value and use a growth rate based on the returns the company makes to determine a target price.
If I find the stock undervalued, I use monthly pivot points to identify support and resistance which I use to enter and exit an investment.
I implemented this strategy last year and is giving me great results.
This simple stock picking strategy has made me money. As long as I have my intrinsic value and pivot levels, I'm good to go. I'm comfortable with this strategy. Plus, I get to spend my time to other ventures that helps me grow my passive income instead of looking daily at the charts. It's easy, risk averse and stress-free compared to daily trading.
If you're like me who loves to look stocks as small pieces of businesses like my greatest influence Warren Buffett, then you'll sure like this post.
So let's begin!
SM Investments Corporation (SM)

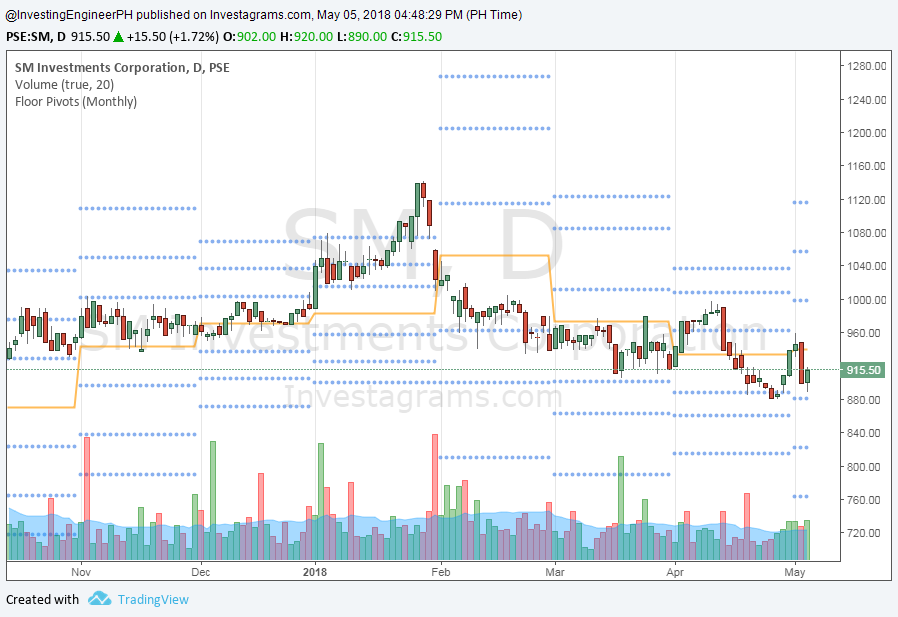
SM's Monthly pivot points to watch. Chart as of May 5, 2018.
Key statistics to consider:
I think SM is already trading at a premium but still is a good buy. I must admit that I made an error in my last fair value calculation of SM. I used the quarterly book value that's posted in PSE Edge's site. Upon checking, it's wrong. PSE Edge should double check the data they post on their site.
As of this post, SM is trading at 3.48x book which is higher than my fair value multiple assumption. I believe that you can get SM at a bargain if the price will trade below 2.59x book value. But assuming a 12% growth for the next three years, SM may possibly trade at ₱1,001 per share which is a 5.7% upside based on a ₱947.50 per share price.
SM just disclosed its capital spending of up to ₱90 billion this year for the expansion its property, retail and banking businesses. This will be financed by internally generated funds.
₱80 billion would go to its property arm SM Prime, while its retail and banking arms would each get about ₱5 billion each.
This is another reason why I think SM is a good buy despite the overvaluation.
On the technical side, the monthly pivot point level is at ₱939.50. Support levels to watch are ₱881, ₱822 and ₱763.50. Resistance levels to watch are ₱998.50, ₱1,057 and ₱1,116 (see chart).
SM Prime Holdings Inc. (SMPH)

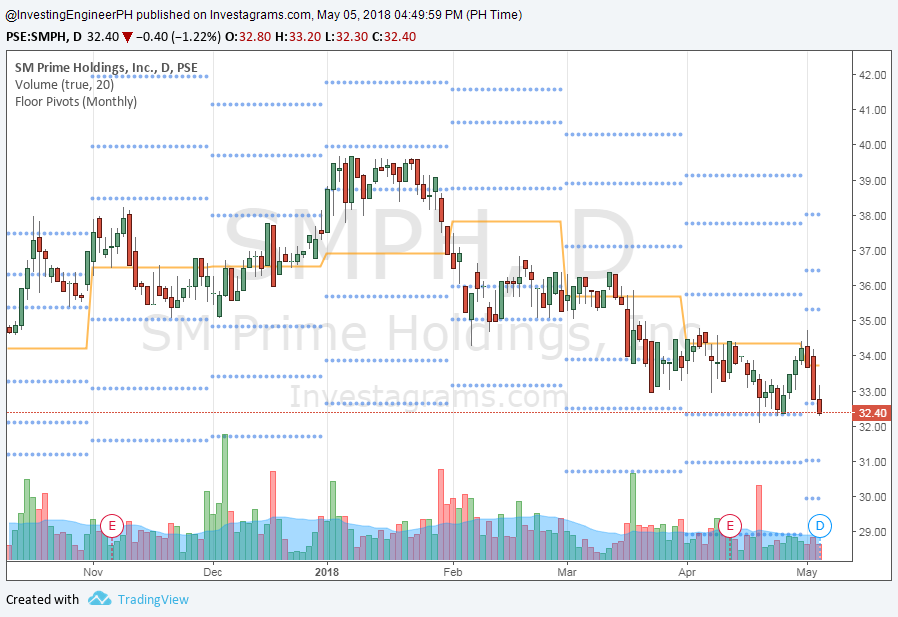
SMPH's Monthly pivot points to watch. Chart as of May 5, 2018.
Key statistics to consider:
if you own SM, you should also definitely own its property arm, SMPH. At ₱33.70 per share, it trades at 3.76x book value.
A price below 3.49x book looks attractive to me and considering a growth of 13% puts it at a target of ₱45.60 per share.
On the technical side, the monthly pivot point level is at ₱34.37. Support levels to watch are ₱32.63, ₱31.02 and ₱29.93. Resistance levels to watch are ₱35.33, ₱36.42 and ₱38.03 (see chart).
Ayala Land Inc. (ALI)

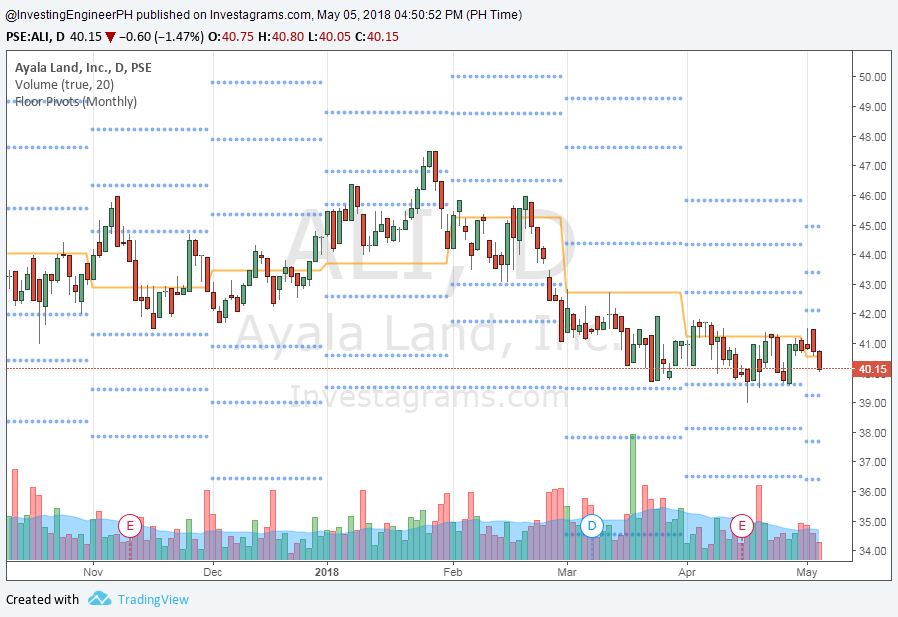
ALI's Monthly pivot points to watch. Chart as of May 5, 2018.
Key statistics to consider:
At ₱40.85 per share, ALI is trading at 3.15x book value which I think is below my assumed fair value multiple of 3.60x. I find it undervalued then.
With a growth of 12%, a target of ₱67.26 might be possible. That's a huge upside at 64.7%. It's always better to sell at this price if it gets hit. For a conservative approach, selling at once it hits intrinsic value is already acceptable.
On the technical side, the monthly pivot point level is at ₱40.55. Support levels to watch are ₱39.25, ₱37.70 and ₱43.40. Resistance levels to watch are ₱42.10, ₱43.40 and ₱44.95 (see chart).
Final Thoughts
Have any thoughts you would like to share? I would love to hear it! Leave them in the comments section below.
Happy investing!


Hello. May I ask about FCF sir? Regarding the capital expenditures, is it the future CAPEX or the CAPEX that were spent during the reporting period? And what is the rationale of why we deduct Net WC to get the FCF? Thank you for you insights sir.
Hi Alvir,
It’s CAPEX during the reporting period.
About the net WC, in a business kasi yung ikot ng pera nasa pagdispose ng inventories, pagbayad ng payables and pagsingil ng receivables. Yung pagbabago ng mga items na yan sa last period compared sa present need natin makuha para macalculate natin yung unlevered FCF. Yung unlevered FCF is yung ginagamit sa DCF model. Ang rationale is shempre need natin malaman yung ‘flow ng cash’. Kaya pag nakuha na natin yung NOPAT, add back yung D&A tapos makukuha natin yung Gross Cash Flow. Gross pa lang yan so hindi pa talaga yan yung cash flow kasi need mo pa iconsider yung changes na net working capital. Maliban diyan, kinukuha din yung change in other investments, assets and liabilities.
Iba yung unlevered FCF sa FCF lang. Pero to simplify the calculations, we often use the FCF na lang which is yung Operating cash less CAPEX.. That process is also similar sa method ni Warren Buffett na Owner Earnings method.