
Universal Robina Corporation (URC) Stock Analysis
Universal Robina Corporation (URC) was founded in 1954 when Mr. John Gokongwei, Jr. established Universal Corn Products, Inc., a cornstarch manufacturing plant in Pasig.
The Company is involved in a wide range of food-related businesses, including the manufacture and distribution of branded consumer foods; production of hogs and day-old chicks; manufacture of animal and fish feeds, glucose and veterinary compounds; flour milling; and sugar milling and refining.
URC operates its food business through operating divisions and wholly owned or majority-owned subsidiaries that are organized into three core business segments, namely, branded consumer foods, agro-industrial products and commodity food products.
The Company is also engaged in consumer product-related packaging business through its packaging division. Majority of URC’s branded consumer foods business is conducted in the Philippines, but the Company has expanded into other Asian markets through its subsidiary, URC International Co., Ltd., and through its three subsidiaries each in China, Singapore and Vietnam; two subsidiaries in Malaysia; and one subsidiary each in Thailand, Indonesia, and Myanmar.
Sector Details:
- Sector: Industrial
- Subsector: Food, Beverage & Tobacco
source: PSE Edge
Author’s note: This is the official post for URC stock analysis. This will be updated every quarter and data will be sourced out from official financial statements and financial websites.
Date of valuation: Jan. 17, 2017
Value Screen Scorecard
Stocks are scored based on Profitability & Growth, Financial Health, Quality, Dividends and Valuation. Each criterion in the list is scored based on financial data for a total of 100 points. Stocks are ranked from 1 to 5, 1 being the highest.
Read this post to get more information on how the value scorecard works.
Scoring Criteria:
- Rank # 1: Extremely good company
- Rank # 2: Good company
- Rank # 3: Average company
- Rank # 4: Needs further study and research to identify the company’s weaknesses
- Rank # 5: Risky company
Value Scorecard (1-17-2017 FY2016)
Profitability & Growth
Criteria # 1: Market Capitalization is 372,503,355,692; (1 pt.)
Criteria # 2: Profit Margins (5-yr. Average); (5 pts.)
- Gross Profit Margin: 30.52%
- Operating Profit Margin: 15.06%
- Net Profit Margin: 13.56%
Criteria # 3: Net Income consistently growing for the last 5 years; (2 pts.)
Criteria # 4: Revenue consistently growing for the last 5 years; (2 pts.)
Criteria #5: Cash & Cash Equivalents consistently growing for the past 5 years; (1 pt.)
Criteria # 6: Operating Cash Flow consistently growing for the past 5 years; (1 pt.)
Criteria # 7: Earnings Per Share consistently growing for the past 5 years; (2 pts.)
Criteria # 8: 5-yr. EPS growth rate at 12.75%; (2 pts.)
Criteria # 9: Return On Equity; (5 pts.)
- 3-year average is 21.31%
- 5-year average is 20.60%
- Previous year’s ROE YoY growth is -20.92%
Criteria # 10: Return On Invested Capital; (2 pts.)
- 5-year average is 16.36%
TOTAL POINTS: 23/30
Financial Health
Criteria # 1: Debt Settlement Capacity; (7 pts.)
- Free Cash Flow in comparison with Long-Term Debt
- Latest Free Cash Flow: Php 10,198,747,852
- Current Long-Term Debt: Php 32,179,158,737
- Current Ratio: 1.70
- D/E Ratio: 0.43
- Interest Coverage Ratio: 24.30
- Working Capital to Total Debt: 0.56
Criteria # 2: Cash To Current Assets; (4 pts.)
- Current C/CA: 0.31
- Recent C/CA: 0.20
Criteria # 3: Inventory To Current Assets; (3 pts.)
- Current I/CA: 0.36
- Recent I/CA: 0.47
Criteria # 4: Accounts Receivable To Current Assets; (4 pts.)
- Current AR/CA: 0.29
- Recent AR/CA: 0.28
Criteria # 5: Accounts Payable To Current Assets; (4 pts.)
- Current AP/CA: 0.35
- Recent AP/CA: 0.36
TOTAL POINTS: 22/25
Quality
Criteria # 1: Piotroski F-Score is 4; (4 pts.)
Criteria # 2: Altman Z-Score is 5.69; (10 pts.)
TOTAL POINTS: 14/20
Dividend Assessment
Criteria # 1: Dividend Payout Ratio is 23.78%; (5 pts.)
Criteria # 2: Dividend Yield is 0.98%; (1 pt.)
TOTAL POINTS: 6/10
Valuation
Criteria # 1: PEGY Ratio is 1.77; (0 pts.)
TOTAL POINTS: 0/15
Final Score: 65 out of 100 points
Stock Ranking: 2
Piotroski F-Score
The Piotroski F-Score is a financial metric model that’s helpful in spotting turnaround businesses. For more information, you may read about it here.
Scoring Criteria:
- 7 to 9 points: Wonderful business
- 5 to 6 points: Average business
- 1 to 4 points: Weak business
Piotroski F-Score (1-17-2017 FY2016)
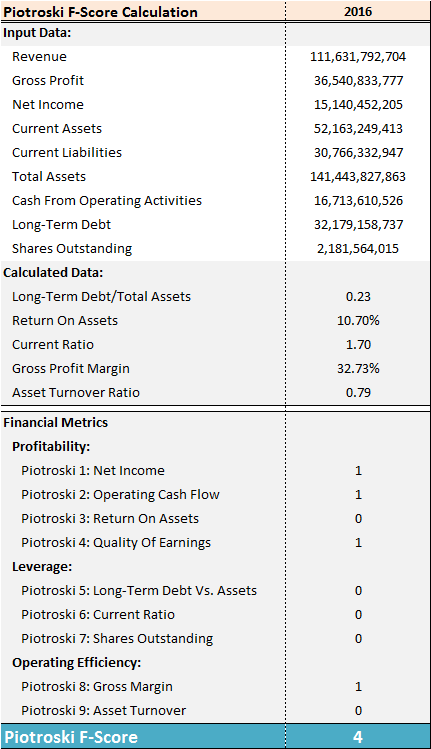
Piotroski F-Score FY2016: 4
Altman Z-Score
The Altman Z-Score is a bankruptcy prediction model that’s helpful in spotting low quality companies. More information about it can be found in this post here.
Scoring Criteria:
- Z > 2.99; “SAFE” Zone (Healthy business)
- Z < 1.81; “DISTRESS” Zone (Troubled business)
- 1.81 > Z > 2.99; “GREY” Zone (Warrants more investigation)
Altman Z-Score (1-17-2017 FY2016)
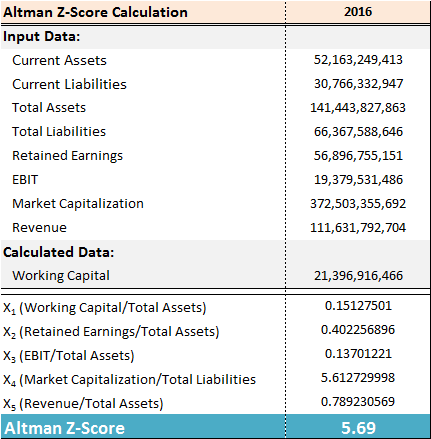
Altman Z-Score 3Q2016: 5.69
Estimated Growth Rates
Estimated growth rates are calculated using exponential chart trend line formula.
Estimated Growth Rates (FY2016)
Revenue Growth
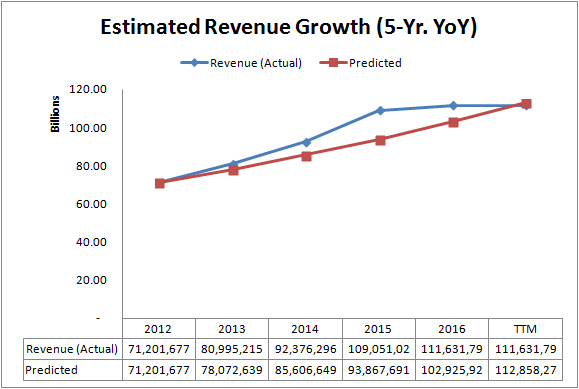
5-Yr. Growth: 9.65%
3-Yr. Growth: 5.91%
Net Income Growth
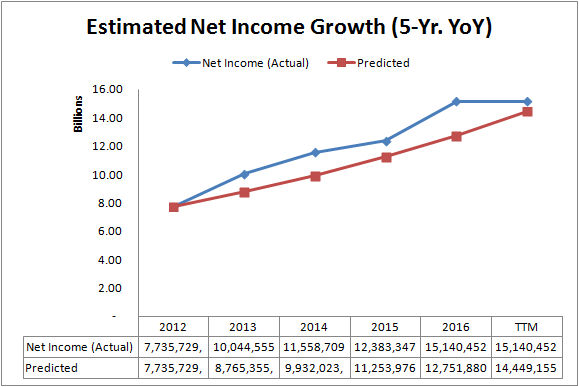
5-Yr. Growth: 13.31%
3-Yr. Growth: 10.11%
Earnings Per Share Growth
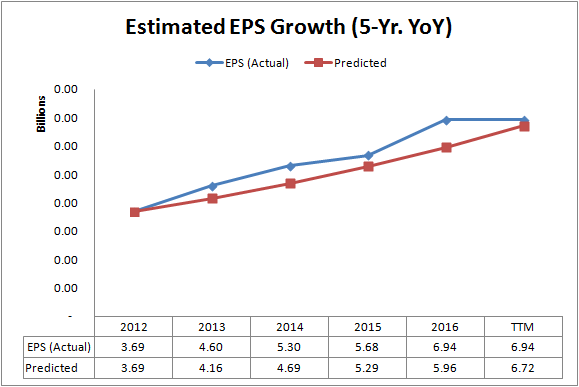
5-Yr. Growth: 12.75%
3-Yr. Growth: 10.09%
Operating Cash Flow Growth
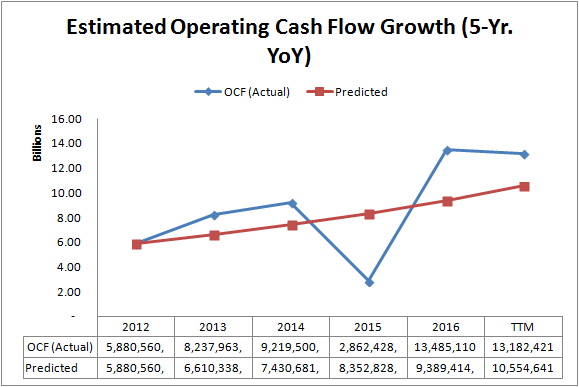
5-Yr. Growth: 12.41%
3-yr. Growth: 26.23%
Intrinsic Value Calculations
The figures and all other variables used in order to get the intrinsic value are listed in detail below for reference purposes so that cross-checking can be made to verify the values obtained.
Intrinsic Value Calculations (1-17-2017 FY2016)
Weighted Average Cost Of Capital (WACC) Calculations
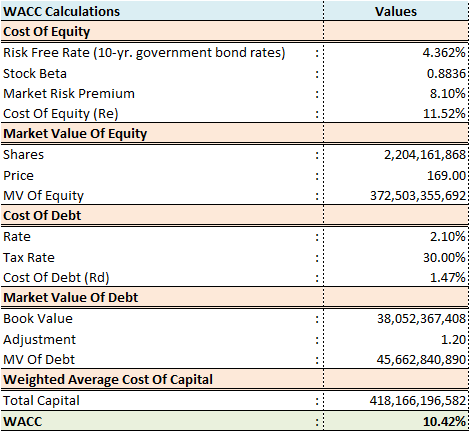
WACC: 10.42%
Discounted Cash Flow (DCF) Calculations
For more information regarding DCF analysis, you may read about it here.
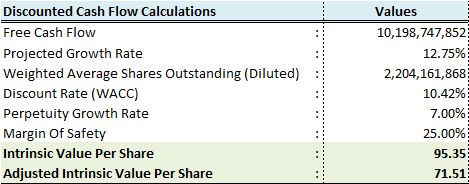
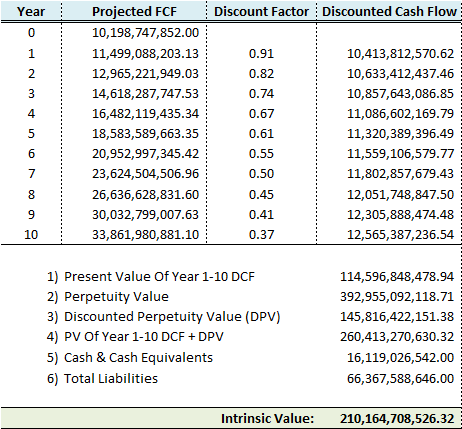
Intrinsic Value: Php 95.35
Adjusted Intrinsic Value (25% MOS): Php 71.51
P/E Valuation Model
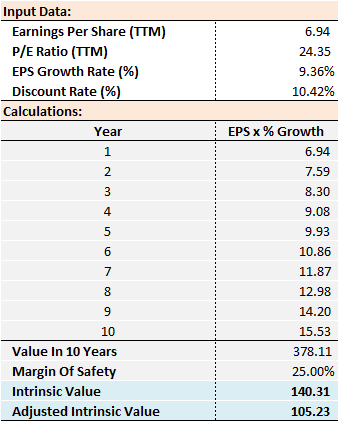
Intrinsic Value: Php 140.31
Adjusted Intrinsic Value (25% MOS): Php 105.23
FURTHER READING (additional analysis):
We love to hear your thoughts! Share them on the comments section below. Happy investing!
Disclaimer: This post contains personal ideas and opinions of the author and is designed for educational purposes only. The author is not responsible for any liabilities and losses which may arise from the use of the information presented in this post.
Great new look on the stock reviews!
A lot to take in… an Intrinsic Value of P95.35?
If I may make a suggestion for your points system, since it’s a new feature in your stock reviews, can you show the criteria on how the points were derived?
For example:
“D/E Ratio is 0.43. (2 pts.)”
Which means that a lower D/E Ratio can earn the stock a ‘1’ rating. Right?
So can you specify, maybe on a separate post that your readers can refer to later, what D/E Ratio range would qualify it as a ‘1’, a ‘2’, etc.
You can then point to this ‘Ratings Explained’ post in a link that you can attach at the bottom of all your future stock reviews, so readers can refer to it if they have any questions.
As always, keep up the good work!
Yes JRP I’m going to make a post about the criteria I’m using. I decided to make such system because investors just want to find good stocks to buy. I’ll try to be as specific as possible and I think this ranking system will give a very quick overview if a stock has some potential or none at all.
I can also update this post everytime a new earnings report will come out with ease.
Thanks Mark! Great to see such improvements on your blog.
I was wondering why it took you a while to make your first post for this year. But seeing the two detailed stock reviews posted one after the other, it was definitely worth the wait.
I’ve spent lots of my downtime reading and understanding more about different Value Investing strategies by different investment professionals. With lots of financial ratios out there, it’s hard to figure out which ones are really useful or not. Some ratios are not really useful in making investment decisions so I decided to just pick those I think will benefit us investors. 🙂
I’ve updated the scorecard. It’s now complete at 100 points. I’ve also made a post about the scorecard here. –> https://investingengineer.com/value-screen-scorecard/
From now on, this scoring system will be used throughout the blog to quickly identify investments with a huge potential.
How did you computed your dividend assessment? im a bit curious because when i tried computing a URC’s dividend yield and pay out, it turned out totally different.