
SBS Stock Review: Thinking Of Investing In SBS For The Long-term?
There’s a lot of hysteria going on with the newly publicly traded company, SBS Corporation (SBS). The stock almost doubled its price since the day it was first traded. Anyone who bought it in its IPO is now enjoying hefty gains.
For now, the speculators are the ones who benefits the most from the stock’s volatility. But to a value investors point of view, the question is; “Is the stock good to hold for the long-term?”
Answering that question means finding out what the company is doing for the past 5 to 10 years. To find it out, we need the historical financial data of the company but sad to say, the only disclosure you can find is their website is their 2014 Annual Report.
With this limited amount of data, it will be hard for us to predict the company’s future cash flows.
For now, we’ll content ourselves with the data we currently have.
Valuations
Let’s look at the historical earnings chart,
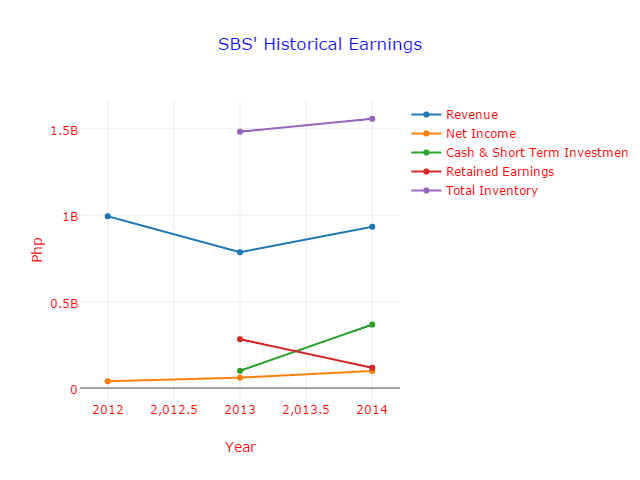
Fig. 1 Historical Earnings
We can see that the revenue and retained earnings declined. Technically, I do not like what I see because how can we predict future earnings if we see declines for the past 3 years. But still, it’s early to say at least because we haven’t evaluated at least 5 years of financial data.
The data above doesn’t tell us much about the company’s future growth but it gives us a hint where it is headed for the next years to come.
Let’s see the EPS;
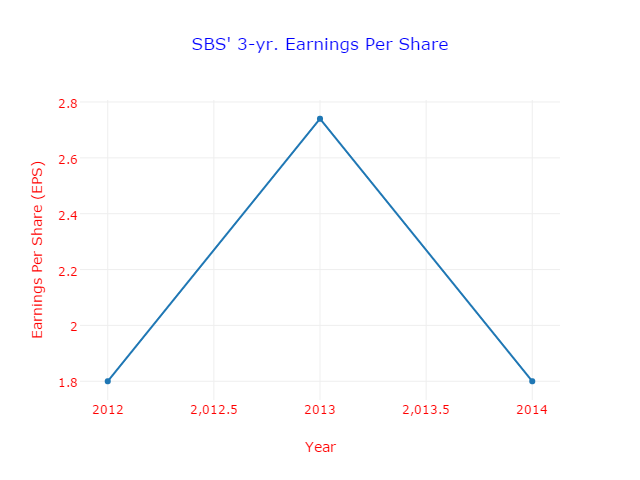
Fig. 2 3-yr Earnings Per Share
The 3-yr. EPS isn’t also good as it shows decline. A good company should show increasing EPS year after year.
Now for the income statement.
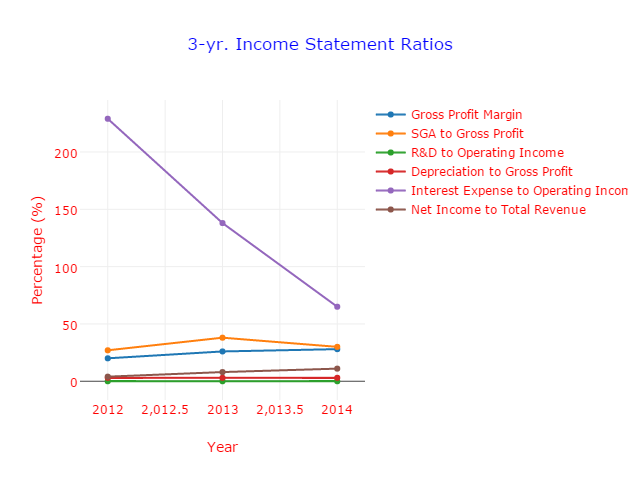
Fig. 3 3-yr Income Statement
One figure you’ll easily notice is the high interest expense to operating income percentage. An ideal value is less than 15% but as you can see, it’s not the case.
This is common in manufacturing companies where large Capital Expenditures are needed to stay competitive. To do this, they incur a lot of debt. And this is explained in their financial statement.
They obtained unsecured short-term debts from local banks on these years. In an investors point of view, it means that the company’s is in a highly competitive industry for the past 3 years.
And this is what the gross profit margin, SG&A to Gross Profit and Net Income to Total Revenue tells us too.
Now let’s glance at the balance sheet.
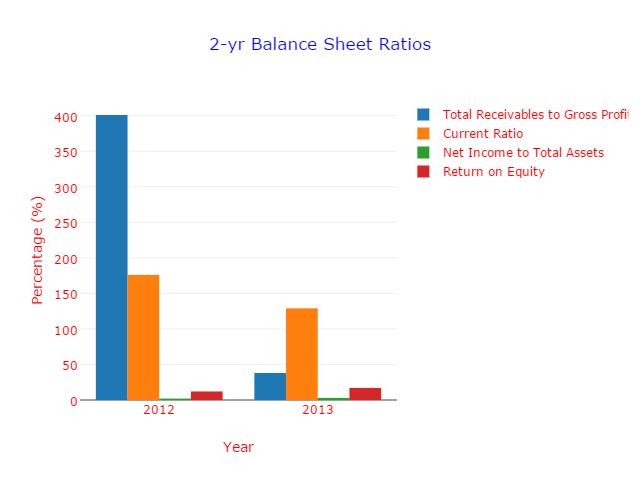
Fig. 4 2-yr Balance Sheet Ratios
The one item that catches my eye when looking at this graph is the high Total Receivables to Gross Profit percentage. SBS announced in their financials that they made advances to other parties. These advances don’t have repayment terms and are due and payable by demand.
That explains the high receivables they got during 2012. A company with a high Receivables to Gross Profit doesn’t have a durable competitive advantage. coupling it with a low ROE, it validates the proposition that the company doesn’t have a competitive advantage.
The cash flow statement’s Net Income to Capital Expenditures ratio is computed at 98%, suggesting that it doesn’t have a durable competitive advantage also.
Last 2013, the sum of Notes Payable/Short-term Debts and Current Portion of Long-term Debts is twice higher than the Cash and Retained Earnings combined suggesting that the company has weak financial health. But in 2014, they had reduced their debts by almost 80% and had since improved.
Initial Rate Of Return
Now to get a quick analysis to know if the stock price is undervalued or not, we now compute its rate of return. With a closing stock price of 5.49 Php today, the %RoR is;
[alert-note]% Rate of Return = (Net Income After Taxes / Market Capitalization) x 100[/alert-note]
[alert-note]% Rate of Return = (100,172,187.00 / 6,588,000,000.00) x 100 = 1.52%[/alert-note]
The 3-yr bond rate as of today is 2.93%. So based on this valuation, the stock is already overvalued.
Actually, this valuation isn’t complete because we lack the financial data to determine more accurately the true financial status of this company. This valuation is only based on a 3-yr data. What we need is at least 5 years worth of financial data to accurately tell if the company has a durable competitive advantage.
Make due diligence and study the financials before investing your hard-earned money.
This concludes my SBS stock review.
Happy investing!