CEB Stock Review: Is CEB Really An Attractive Investment?
I was looking at Truly Rich Club's SAM Table and the one stock I noticed that looks very attractive to purchase is CEB (Cebu Pacific Air).
As of this writing, CEB’s buy below price is ₱124.80 and its closing price is ₱84.60. A quick look at these figures suggests an undervalued company considering the SAM Table’s target price of ₱156.00.
The stock looks promising to new investors so I decided to read through CEB’s financials if it really has good fundamentals because from what I’ve learned from the greatest investors like Warren Buffett, airline companies have huge SGA and Depreciation costs which makes them a little unattractive to invest with.
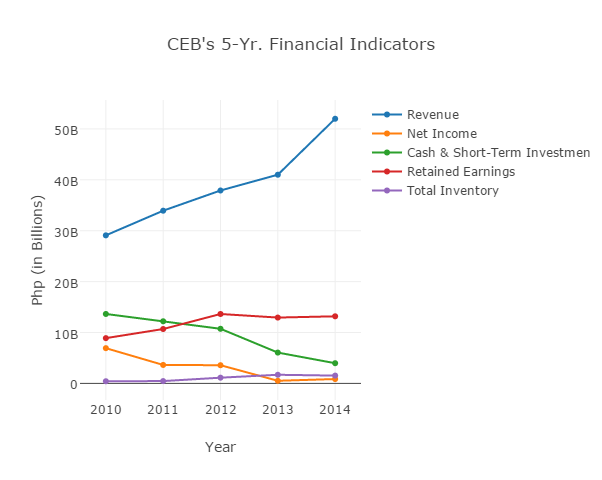
I gathered data for the past 5 years to find if the company is consistently growing. So here’s CEB’s 5-year financials and the 5-year EPS.
Let's see what we'll dig through.
5-Yr. Financial Indicators
5-Year Earnings Per Share
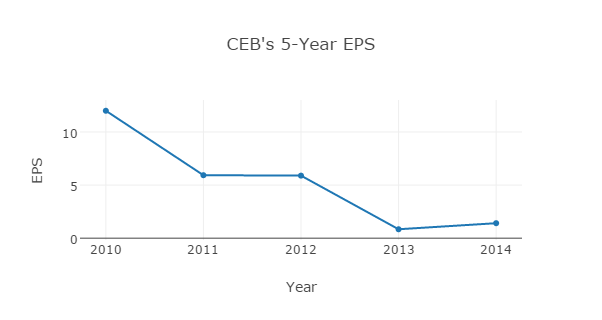
CEB’s EPS doesn’t show a consistent rise. One of Warren Buffet’s criteria in a company with a durable competitive advantage is that it should have a consistent rising EPS. This is not the case in here.
CEB’s EPS doesn’t show a consistent rise. One of Warren Buffet’s criteria in a company with a durable competitive advantage is that it should have a consistent rising EPS. This is not the case in here.
To verify if expenses increased, let’s take a quick look at CEB’s Income Statement.
5-Year Income Statement
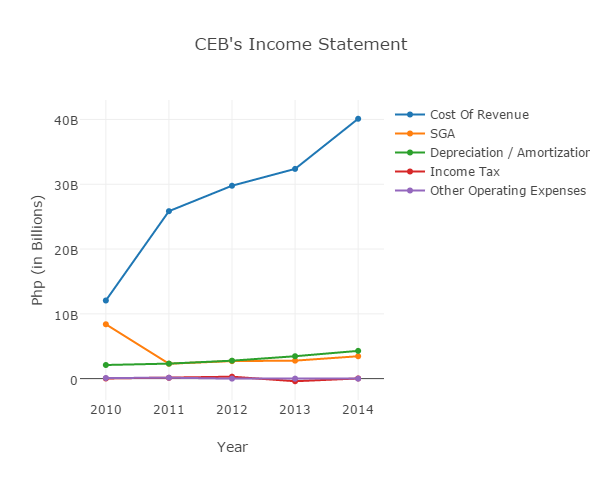
The 5-Yr. graph shows that the Cost Of Revenue and Depreciation & Amortization continued to increase within the 5-yr span. The SGA fell down on 2011 but gradually increased from 2011 to 2014 while the Taxes paid by CEB is erratic. When you subtract all of these to the Total Revenue, we get the Operating Income.
Warren Buffett’s investing principle tells us that for a company to be a good investment for the long-term, it should have consistent growth on the items mentioned in the 5-yr. financial indicator graph. So by looking at it, CEB fails Warren Buffett’s standards.
Anyway, what do the Income Statement Indicators tell about the company? Let’s have a look at it below.
5-Year Income Statement Indicators
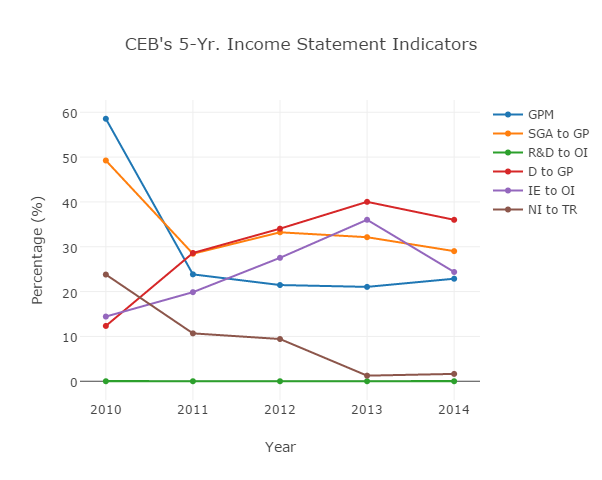
To easily understand the data, I’ve computed the 5-yr. averages of the indicators.
What I can derive from these data is that CEB isn’t in a durable competitive advantage. CEB again fails Warren Buffet’s criteria.
Let’s not lose hope yet. For now, let’s see what the Balance Sheet has to say. Let’s look at the Total Receivables to Gross Profit.
5-Year Total Receivables to Gross Profit
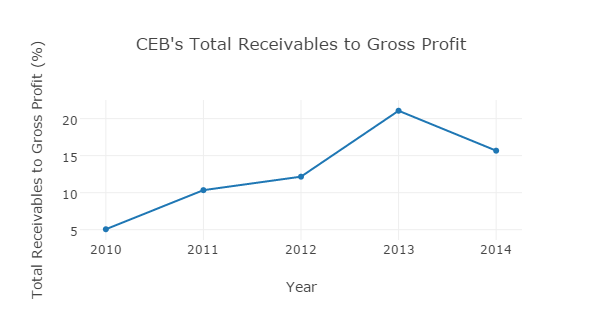
TR to GP should be low in order for a company to be an attractive investment. To accurately tell if it’s low we need to compare it to other companies with the same industry. If you find it lower compared to other competitors, then the company is somewhat in a competitive edge.
Now for the Return On Equity;
5-Year Return On Equity
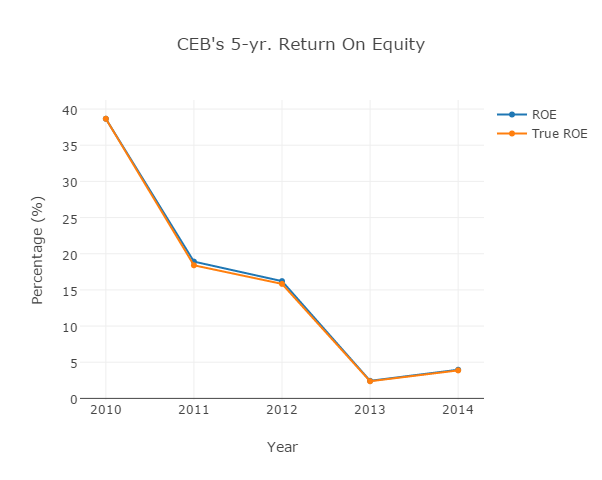
The chart shows a declining RoE for the last 5-years. This is not good. As you may have read above, the EPS is also decreasing for the last 5 years. Does this mean that CEB isn’t efficiently managing its profits for the last 5 years? If that’s the case, CEB again fails Warren Buffet’s criteria.
In CEB’s Cash Flow Statement, the Capital Expenditures to Net Income percentage when computed is at 274%. As much as possible, we want companies with 50% and below percentage. So again, CEB fails Warren Buffett’s criteria.
Final Thoughts
Now I wonder why CEB is included in the SAM Table. It may be because there is a compelling reason behind it which only the analysts and experts understand.
If I’ll be given the chance to invest in CEB for the long-term, I’ll think otherwise. The fundamentals discussed above isn’t attractive enough to convince me despite having a buy rating in COL Financial’s Investment Guide and Truly Rich Club’s SAM Table.
Happy investing!

ito yun magandang technical analysis na nabasa ko.. thanks for sharing!
Thank you sudogem sana makatulong yung information sa pag-iinvest mo. 😀
nice input on the fundamentals using warren buffet’s strategy in stock picking, where can i find a good book about this one?
Hi Tera, you may try to search for the book “Warren Buffet and the Interpretation of Financial Statements” by Mary Buffet and David Clark.
Nice analysis…please share also about AEV. Thanks I’m following your articles
Hi Tania, sure no problem. If I find another spare time I’ll look into AEV na rin. 🙂
NICE!! Engineered!!
Hopefully Sir ma-share nyo din po regarding P/E ratio
or analysis MPI vs X. Salamat po.
New follower here 🙂
Thanks luffy. I’ll look it up na rin next time. 🙂
Wow ganda naman ng analysis sana FPH naman sunod, good job sir…
where did you get COGS from 2010-2014? thanks!
Hi Trina, the data came from Financial Times website.
may i also know what reference was used for the SGA and D&A? thank you! 🙂
This link might help you. http://markets.ft.com/data/equities/tearsheet/financials?s=CEB:PHS&subview=IncomeStatement
Back then, FT lists 5-years worth of data. I suggest you try to use Wall Street Journal or MorningStar. I prefer Morningstar better.
Thank you so much! 🙂 appreciate the tip!
No problem. 🙂
long shot question. would you know where to find ceb air inc’s historical stock prices dating back to 2011 quoted in PHP? PSE lists only 30 days and the others are quoted in USD. 🙂
Try this one. http://quotes.wsj.com/PH/CEB/historical-prices
thank you so much! 🙂 still have to do DCF and EVA. x_x
Last!!! Can’t seem to find PAL’s annual reports. It’s not on their website. I only saw Corp Gov reports for 2014 and 2012. Would you possibly know where I can obtain 2011, 2013 and 2015? Thank you so much for your help in adv!
Unfortunately I have the same problem. When I search in google, I see links coming from a japanese website (jp.philippineairlines.com). You can find the 2011 report there.
You may try going to PSE Edge for the 2015 report. For the 2014, try calling their investor relations dept. and ask assistance. They might give you a download link or they may email you the files. I think it’s possible since they are public docs but I haven’t tried that yet.
Anyways, I hoped it helped. Goodluck Miss Trina. 🙂
thank you so much for your help! 🙂
No problem Trina, don’t hesitate to ask if you need more help. 🙂
Do you still think CEB is not worth buying this time?
Thanks 🙂
Hi Ivy,
Here’s a tip from TRC.. CEB is a buy because of good passenger growth and stabilizing oil prices. Target price would be Php 113.00.
Good luck in your investments. 🙂