
Picture two investors in October 2016. Each puts $10,000 into four dividend stocks. The first buys high yielders paying about 4.5%: Altria, Verizon, AT&T and Realty Income. The second buys dividend growers paying about 2.4%: Microsoft, Home Depot, ADP and Lowe’s. That’s the dividend growth vs high yield debate in its simplest form.
Ten years later, with dividends reinvested, the high-yield investor has about $17,400. The dividend-growth investor has about $52,600. Here’s the twist: if neither had reinvested, their total cash dividends over the decade would differ by only about $530.
So which strategy actually builds more wealth? As an engineer, I don’t like slogans. I like formulas, dated numbers and stress tests. In this guide we’ll compare both strategies on three separate scoreboards, work through the math of when a grower’s income overtakes a high yielder’s, and look at 50 years of evidence. Then you’ll get a framework to decide which one fits you.
Dividend Growth vs High Yield: The Short Answer
Dividend growth vs high yield, defined: Dividend growth investing buys companies with modest starting yields but fast-rising payouts. High-yield investing buys companies with large starting yields but slow or no payout growth. The real trade-off is when you get paid: high yield pays more now, while dividend growth aims to pay more later.
Over long periods, total return has usually favored dividend growth backed by business quality. A well-covered high yield delivers more cash in the early years and can hold up better in some market regimes.
Key Takeaways
- Growers have won the long game. From 1973 to 2025, S&P 500 dividend growers and initiators returned 10.22% a year. Dividend cutters and eliminators lost 0.96% a year (Hartford Funds/Ned Davis Research).
- The fund-level gap is smaller. From December 2006 to October 20, 2026, VIG (dividend growth) returned 10.1% a year and VYM (high dividend yield) returned 9.2%.
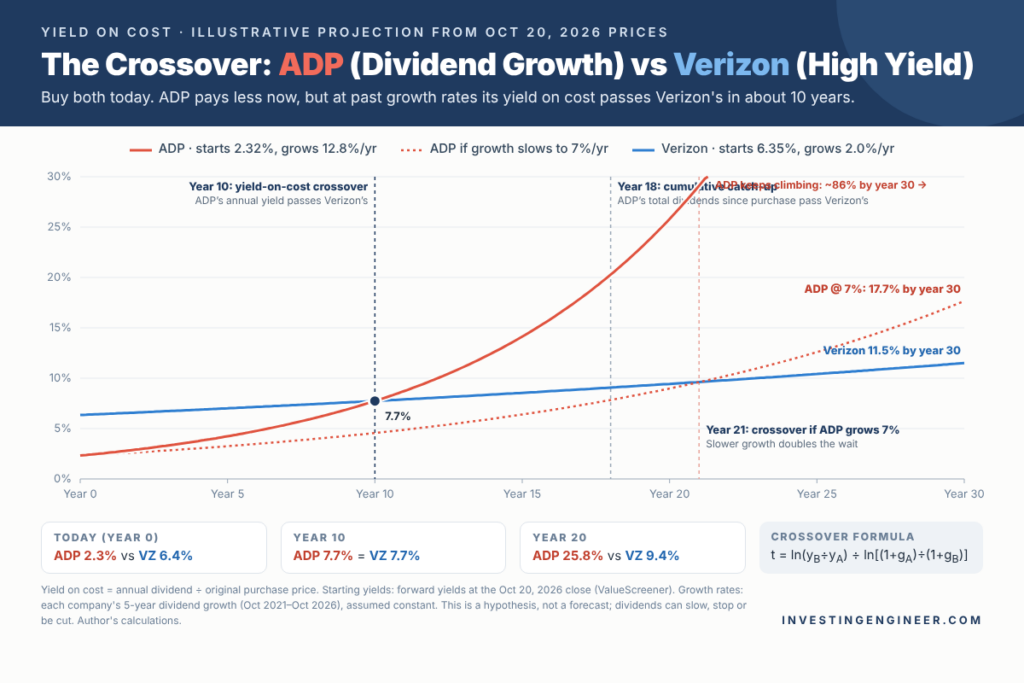
- The growth gap decides the crossover. At past growth rates, ADP’s yield on cost passes Verizon’s in about 10 years. Cumulative income takes about 18 years to catch up.
- Reinvesting changes the scoreboard. Reinvested high yields buy many more shares. So the high-yield basket ended with more annual income even though it built far less wealth.
- Regimes matter. High yield won 2022’s rate shock (VYM –0.5% vs VIG –9.8%). Dividend growth fell less in the 2007–09 crash.
- High yield’s edge is mostly value in disguise. Academic studies find that its outperformance comes mainly from value and defensive factors, not the dividend itself.
What Is Dividend Growth Investing vs High-Yield Investing?
Dividend Growth Stocks Explained
A dividend growth stock raises its payout year after year, usually because earnings and free cash flow are growing. The starting yield is often only 1–3%. The appeal is compounding: a 10% annual raise doubles the dividend in about seven years.
ADP is a good example. It raised its dividend 10% in November 2025, its 51st consecutive year of increases.
High-Yield Dividend Stocks Explained
A high-yield stock pays a large dividend relative to its price, often 5% or more. These are typically mature businesses: tobacco, telecom, utilities or real estate investment trusts (REITs). They pay out most of their cash because they have fewer ways to reinvest it. Payout growth tends to be slow, around 0–4% a year.
How Index Providers Draw the Line
| Style | Index (ETF) | Rule of thumb |
|---|---|---|
| Dividend growth | S&P 500 Dividend Aristocrats (NOBL) | 25+ consecutive years of increases |
| Dividend growth | S&P U.S. Dividend Growers (VIG) | 10+ years of increases; excludes the top 25% highest yielders |
| Dividend growth | Morningstar US Dividend Growth (DGRO) | 5+ years of growth plus a payout screen |
| High yield | FTSE High Dividend Yield (VYM) | Above-median forecast yields, excluding REITs |
| High yield | S&P 500 High Dividend (SPYD) | The 80 highest-yielding S&P 500 stocks |
| High yield + quality | Morningstar Dividend Yield Focus (HDV) | High yield screened for financial health |
Notice that most dividend-growth indexes deliberately cut off the highest yielders. Index designers know that the top-yield tail is where future dividend cutters tend to hide.
The Math: Yield on Cost and the Crossover Point
Yield on cost is your current annual dividend divided by the price you originally paid. If you bought ADP at $87.06 in October 2016, its current $6.80 annual dividend gives you a 7.8% yield on cost, even though a new buyer today gets only 2.3%.
The Crossover Formula
The crossover point is the year a low-yield grower’s yield on cost overtakes a high yielder’s. If stock A starts at yield y_A and grows its dividend at g_A, and stock B starts at y_B and grows at g_B, the crossover year is:
t = ln(y_B ÷ y_A) ÷ ln[(1 + g_A) ÷ (1 + g_B)]
Worked example: ADP vs Verizon (yields as of October 20, 2026; 5-year dividend growth rates assumed to continue):
- ADP yields 2.32% and has grown its dividend about 12.8% a year.
- Verizon yields 6.35% and has grown its dividend about 2.0% a year.
- Numerator: ln(6.35 ÷ 2.32) = 1.007.
- Denominator: ln(1.128 ÷ 1.020) = 0.101.
- Crossover: 1.007 ÷ 0.101 ≈ 10 years.
Why Cumulative Income Takes Much Longer
Passing Verizon’s annual yield in year 10 doesn’t mean ADP has paid you more in total. Verizon banked a big head start in the early years. On my numbers, ADP’s cumulative income doesn’t catch up until about year 18. As a rule of thumb, cumulative catch-up takes roughly 1.5 to 2 times as long as the yield-on-cost crossover.
How Sensitive Is the Crossover?
This is where most articles stop too early. The crossover year depends heavily on whether the growth rate holds.
| Pair (current yield / assumed growth) | Yield-on-cost crossover | Cumulative income catch-up |
|---|---|---|
| ADP (2.32% / 12.8%) vs Verizon (6.35% / 2.0%) | ~10 years | ~18 years |
| Lowe’s (2.52% / 9.3%) vs AT&T (4.73% / 0%) | ~7 years | ~14 years |
| Home Depot (2.96% / 7.1%) vs Altria (5.95% / 4.3%) | ~26 years | ~41 years |
| Microsoft (0.74% / 9.6%) vs Realty Income (5.78% / 2.9%) | ~33 years | ~47 years |
Now a generic case: a grower starting at a 2.5% yield vs a high yielder starting at 6.0%. Each cell shows the yield-on-cost crossover year / the cumulative income catch-up year.
| Grower’s dividend growth | High yielder grows 0% | High yielder grows 2% | High yielder grows 4% |
|---|---|---|---|
| 5% | 18 / 33 | 30 / 49 | 92 / never |
| 7% | 13 / 24 | 18 / 31 | 31 / 46 |
| 9% | 10 / 19 | 13 / 23 | 19 / 30 |
| 11% | 8 / 16 | 10 / 19 | 13 / 23 |
| 13% | 7 / 14 | 9 / 16 | 11 / 18 |
Note: The growth gap matters far more than the yield gap. A grower generally needs a 5 to 7 percentage-point growth advantage for the crossover to happen within a typical 10–20-year horizon.
What the Long-Term Evidence Says
50 Years of S&P 500 Data by Dividend Policy
Hartford Funds and Ned Davis Research sorted S&P 500 stocks by what each company did with its dividend. Here are the results for 1973–2025:
| Dividend policy | Annualized return | Beta | Standard deviation |
|---|---|---|---|
| Dividend growers & initiators | 10.22% | 0.89 | 15.97% |
| Dividend payers (all) | 9.20% | 0.94 | 16.71% |
| No change in dividend | 6.87% | 1.02 | 18.45% |
| Dividend non-payers | 4.21% | 1.18 | 21.91% |
| Dividend cutters & eliminators | –0.96% | 1.22 | 24.80% |
| Equal-weighted S&P 500 | 7.74% | 1.00 | 17.55% |
Source: Hartford Funds, “The Power of Dividends” (2026 edition).
Two findings stand out. First, growers earned the highest return with the lowest volatility. Second, cutters destroyed wealth. The same study found that the highest-yield quintile of stocks beat the S&P 500 only about half the time. The second-highest quintile did better, and its payout ratio averaged 49% vs 72% for the top quintile.
VIG vs VYM vs the S&P 500 Since 2006
Stock-level studies aren’t something you can buy. Index funds are. Here’s how two popular Vanguard dividend ETFs did against the S&P 500 (SPY), with dividends reinvested:
| Measure | VIG (dividend growth) | VYM (high dividend yield) | SPY (S&P 500) |
|---|---|---|---|
| Annual return, Dec 2006 – Oct 20, 2026 | 10.1% | 9.2% | 10.9% |
| $10,000 grew to (same period) | ~$67,100 | ~$56,900 | ~$77,900 |
| Annual return, last 10 years (Oct 2016 – Oct 2026) | 13.6% | 11.9% | 15.6% |
| 2008 calendar year | –26.7% | –31.9% | –36.8% |
| Peak-to-trough, Oct 2007 – Feb 2009 | –40.9% | –51.6% | –50.8% |
| Jan – Mar 2020 | –17.2% | –22.0% | –19.4% |
| 2022 calendar year | –9.8% | –0.5% | –18.2% |
My calculations from monthly adjusted prices (Alpha Vantage). Month-end data; fees included, taxes excluded.
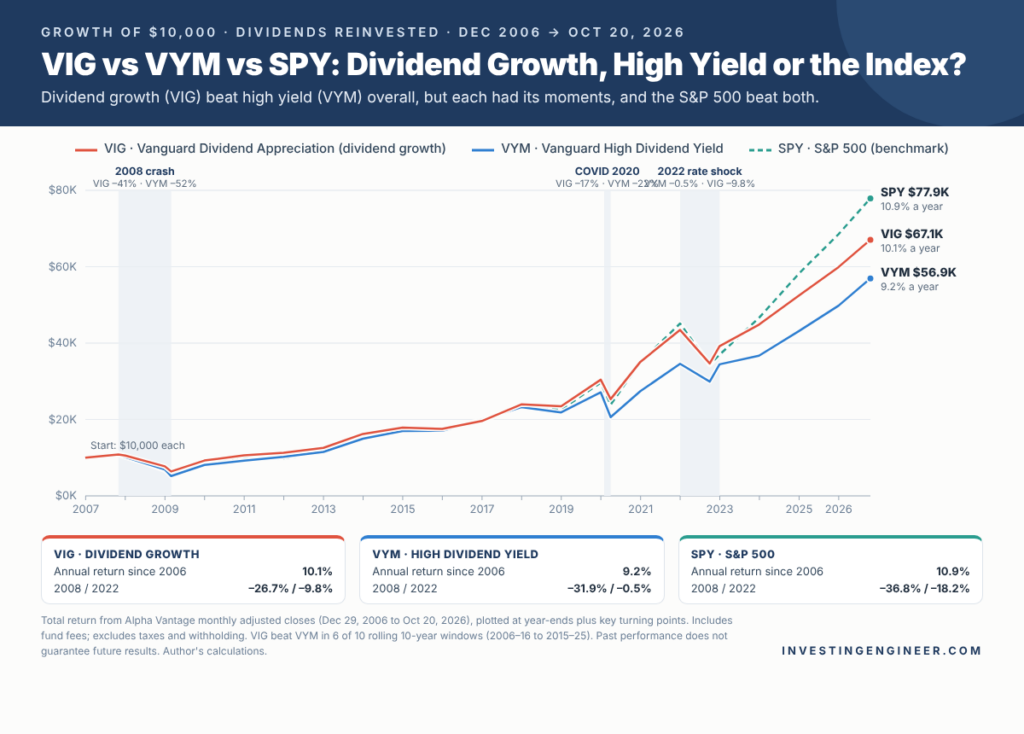
Keep in mind that VYM is a broad fund. Its yield is far lower than the 5–6% single-stock yields in our case study, so it represents moderate high yield, not maximum yield. For a closer look at one alternative, see our SCHD vs VYM comparison.
Rolling 10-Year Returns: Who Won Each Decade?
One start date can mislead you, so I checked every 10-year window ending in a calendar year:
| 10-year window | VIG | VYM | Winner |
|---|---|---|---|
| 2006–2016 | 7.0% | 7.1% | VYM |
| 2007–2017 | 8.5% | 8.6% | VYM |
| 2008–2018 | 11.7% | 12.2% | VYM |
| 2009–2019 | 12.6% | 12.9% | VYM |
| 2010–2020 | 12.7% | 11.5% | VIG |
| 2011–2021 | 14.4% | 13.0% | VIG |
| 2012–2022 | 12.0% | 11.6% | VIG |
| 2013–2023 | 10.7% | 9.4% | VIG |
| 2014–2024 | 11.4% | 9.8% | VIG |
| 2015–2025 | 13.1% | 11.3% | VIG |
VIG won 6 of 10 decades. VYM won the windows that started near the 2008 crash, when beaten-down value stocks rebounded hardest. The margins were small in either direction.
Why Growers Win: Quality, Not the Dividend Itself
Here’s the part most dividend articles skip. When researchers control for well-known return factors, the “dividend premium” mostly disappears:
- Chen and Israelov (2024). In US stocks from 1964 to 2021, high-dividend stocks’ outperformance was largely explained by value, profitability, investment and low-beta factors. Alpha fell from 4.8% to roughly zero (summary by Larry Swedroe).
- Fisher (2013). In a factor attribution of Russell 3000 stocks from 1979 to 2012, the dividend-yield factor itself subtracted about one percentage point a year. Value and earnings yield did the heavy lifting (Journal of Financial Planning).
The practical lesson: dividend growth works mostly because it’s a proxy for quality. Rising dividends usually come from rising earnings, high returns on capital and disciplined balance sheets. High yield works when it’s a proxy for cheapness, and it fails when the cheapness is deserved.
Case Study: $10,000 in Dividend Growers vs High Yielders (2016–2026)
The Two Baskets
| Ticker | Price | Forward yield | 10-yr dividend growth (per yr) | 5-yr dividend growth (per yr) | P/E | Free cash flow yield |
|---|---|---|---|---|---|---|
| MSFT | $531.87 | 0.74% | 9.6% | 9.6% | 29.6x | 1.69% |
| HD | $315.11 | 2.96% | 12.9% | 7.1% | 22.1x | 4.03% |
| ADP | $292.75 | 2.32% | 11.5% | 12.8% | 26.7x | 4.44% |
| LOW | $198.53 | 2.52% | 13.6% | 9.3% | 16.7x | 6.88% |
| MO | $74.64 | 5.95% | 6.2% | 4.3% | 18.1x | 7.22% |
| VZ | $44.54 | 6.35% | 2.1% | 2.0% | 11.0x | n/a |
| T | $23.45 | 4.73% | –5.3% | –11.8% | 7.7x | 11.55% |
| O | $56.34 | 5.78% | 3.0% | 2.8% | n/m (REIT) | 7.55% |
Data: ValueScreener company reports, built from SEC filings, as of the October 20, 2026 close. Dividend growth rates are my calculations from declared per-share rates (October 2016 or October 2021 to October 2026). (I earn a commission if you subscribe to ValueScreener through this link.)
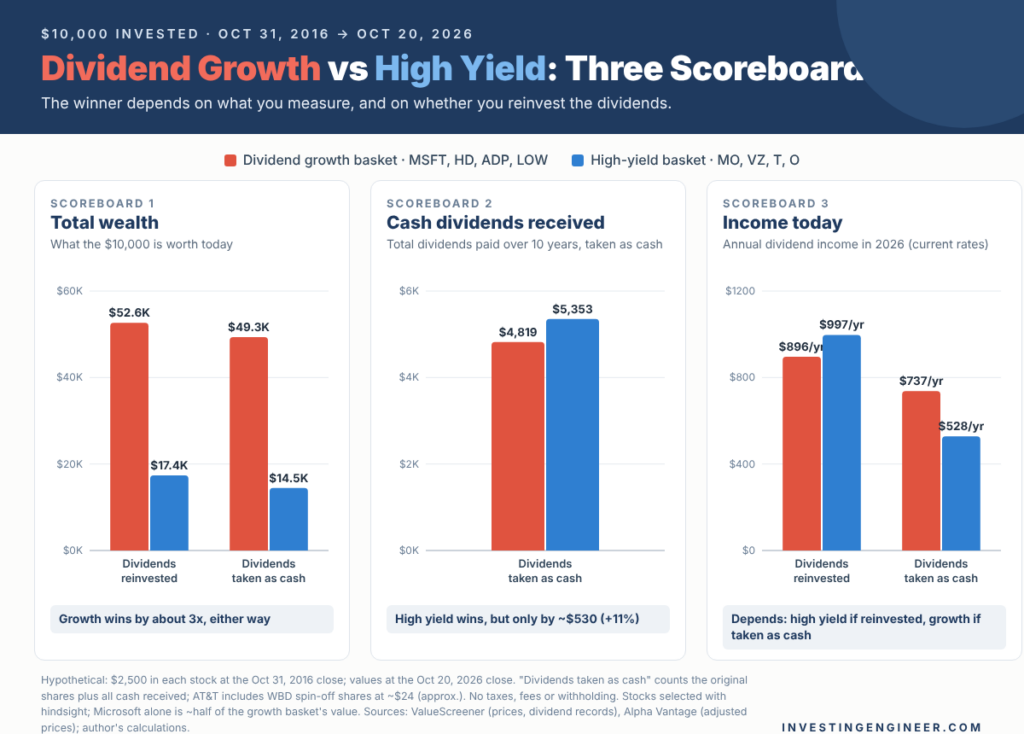
The test. I split $10,000 equally across each basket’s four stocks ($2,500 each) at the October 31, 2016 close and held them to October 20, 2026. I ran it two ways: with every dividend reinvested (DRIP) and with dividends taken as cash. There are no taxes or fees.
Scoreboard 1: Total Wealth
| Basket | Value with dividends reinvested | Annual return | Value without reinvesting (shares + cash received) |
|---|---|---|---|
| Dividend growth (MSFT, HD, ADP, LOW) | $52,646 | 18.1% | $49,320 |
| High yield (MO, VZ, T, O) | $17,366 | 5.7% | $14,461 |
| 50/50 blend of all eight | $35,006 | 13.4% | $31,891 |
Growth won by a mile. Look at the share prices: all four growers’ prices compounded at roughly 10–25% a year. Three of the four high yielders ended the decade below their 2016 prices: Verizon (–0.8% a year), AT&T (–4.4% a year) and Realty Income (–0.5% a year). Altria eked out +1.2% a year. Almost all of the high-yield basket’s return came from the dividend itself.
Scoreboard 2: Cumulative Dividends Received
Without reinvesting, the high-yield basket paid $5,353 in cash over 10 years. The growth basket paid $4,819. High yield started with about 85% more income ($445 vs $240 a year), yet it collected only about 11% more cash over the decade.
Scoreboard 3: Income Today
By 2026, the growth basket’s original shares were paying $737 a year, against $528 for the high-yield basket. The baskets’ annual income crossed over around year 6 or 7. Growers’ payouts had roughly tripled, while the high yielders’ rose by only about 19% in total, dragged down by AT&T’s 2022 cut.
There’s one nuance worth knowing. With full reinvestment, the high-yield basket ended with more annual income ($997) than the growth basket ($896). Reinvesting a big yield buys many more shares, so if your only goal is maximum income at the end and you reinvest everything, high yield stays competitive, even with a third of the wealth.
The Hindsight Caveat
Read this before you draw conclusions. These eight names were picked in 2026, with hindsight. Microsoft alone turned $2,500 into about $25,000, which is roughly half of the growth basket’s final value. Even without Microsoft, though, each of the other three growers still beat every high yielder. Treat this as an illustration of the mechanics, not proof.
When High Yield Turns Into a Yield Trap
A yield trap is a stock whose high yield exists because its price fell in anticipation of a dividend cut or business decline. Since yield equals dividend ÷ price, the yield goes up before the cut lands.
Case Study: AT&T’s 2022 Dividend Reset
| FY2025 | |
|---|---|
| ROIC | 8.3%[1] |
| Debt to equity | 1.45[1] |
| Current ratio | 0.91[1] |
| Market cap | 160.70B USD Market data |
| P/E | 7.7x Market data |
| P/B | 1.5x Market data |
| P/S | 1.3x Market data |
| EV/EBIT | 12.8x Market data |
| FCF yield | 11.6% Market data |
| Dividend yield | 4.7% Market data |
[1] 10-K, accession 0000732717-26-000120, fiscal year 2025, filed 2026-02-09.
Market data: quotes as of 2026-10-20.
Filed figures cite the SEC filing they come from; figures marked Market data are quotes as of the date shown. Not a recommendation and not advice.
Research AT&T Inc. on ValueScreener
I earn a commission if you subscribe to ValueScreener through this link.
AT&T was a classic “safe” high yielder. It had raised its dividend for decades and paid $0.52 a quarter through early 2022. Then the WarnerMedia spin-off closed in April 2022, and the quarterly dividend was reset to $0.2775, a 47% cut (AT&T announcement).
To be fair, shareholders also received about 0.24 Warner Bros. Discovery shares for each AT&T share. So the reset was part cut, part spin-off. Still, the warning signs had been visible for years:
- The share count jumped from 6.2 billion to 7.6 billion after the Time Warner acquisition.
- Net debt/EBITDA was above 4x from 2020 to 2022.
- Revenue fell from its 2019 peak.
A 2016 buyer earned about 4.3% a year with reinvestment, and the income from the original shares is now lower than it was in 2016.
Today the picture is different. AT&T’s 2025 free cash flow of $19.4 billion covers its roughly $8 billion dividend about 2.4 times. That makes its 4.73% yield a post-cut, well-covered yield. That’s the irony of yield traps: the safest time to own a high yielder is often after the cut. For another example of an income stock resetting its payout, see our BP vs Shell dividend comparison.
Case Study: Altria’s High Yield, Still Standing
| FY2025 | |
|---|---|
| ROIC | n/a |
| Debt to equity | n/m |
| Current ratio | 0.65[1] |
| Market cap | 124.60B USD Market data |
| P/E | 18.1x Market data |
| P/B | n/m |
| P/S | 5.4x Market data |
| EV/EBIT | n/a |
| FCF yield | 7.2% Market data |
| Dividend yield | 5.8% Market data |
[1] 10-K, accession 0000764180-26-000017, fiscal year 2025, filed 2026-02-25.
Market data: quotes as of 2026-10-20.
Filed figures cite the SEC filing they come from; figures marked Market data are quotes as of the date shown. Not a recommendation and not advice.
Research Altria Group, Inc. on ValueScreener
I earn a commission if you subscribe to ValueScreener through this link.
Altria shows that some high yields can last. Cigarette volumes fell 3.2% in Q2 2026 (4.5% after adjusting for trade inventory), and revenue has drifted lower for a decade. Yet Altria keeps paying more:
- Pricing power. Marlboro’s average retail pack price rose $0.60 year over year to $10.15.
- Buybacks. Diluted shares fell from 1.95 billion (2016) to 1.68 billion (2025).
- Steady cash. Free cash flow has held around $8–9 billion a year since 2018.
In August 2026 it announced its 61st dividend increase in 57 years and is targeting mid-single-digit growth through 2028. With reinvestment, Altria returned about 8.5% a year from 2016 to 2026, the best of the high-yield basket. The risk is that pricing power can’t outrun volume decline forever. That’s a judgment call, not a certainty.
7 Yield-Trap Warning Signs
- The yield is far above the company’s own history and its peers. A sudden jump usually reflects a falling price, not a rising dividend.
- The payout ratio is above about 80% of earnings, or dividends exceed free cash flow. For REITs, use AFFO (adjusted funds from operations) instead of free cash flow.
- Leverage is rising. Net debt/EBITDA above about 3.5x leaves little room for error.
- Revenue is shrinking in a secular decline, and pricing power can’t offset it.
- The share count is rising. Dilution means each dividend is spread across more shares.
- Dividend growth has stalled for several years, or management talks about “flexibility.”
- A big acquisition or spin-off is pending. These are classic moments for a dividend reset.
Check these signs yourself
Every warning sign above is a number you can look up
ValueScreener reads each company’s figures from its SEC filings and dates every one, so you can run the yield-trap checklist in minutes:
- ✓Full dividend record, with every declared rate and ex-date
- ✓Up to 10 years of free cash flow, margins and EPS
- ✓Net debt/EBITDA and share-count trend (buybacks vs dilution)
- ✓Dividend yield, FCF yield and shareholder yield side by side
Check a dividend stock on ValueScreener → I earn a commission if you subscribe to ValueScreener through this link.
When Dividend Growth Disappoints
Home Depot: When the Growth Assumption Breaks
| FY2025 | |
|---|---|
| ROIC | 19.9%[1] |
| Debt to equity | 5.33[1] |
| Current ratio | 1.06[1] |
| Market cap | 314.40B USD Market data |
| P/E | 22.1x Market data |
| P/B | 24.5x Market data |
| P/S | 1.9x Market data |
| EV/EBIT | 18.2x Market data |
| FCF yield | 4.0% Market data |
| Dividend yield | 3.0% Market data |
[1] 10-K, accession 0001628280-26-019436, fiscal year 2025, filed 2026-03-18.
Market data: quotes as of 2026-10-20.
Filed figures cite the SEC filing they come from; figures marked Market data are quotes as of the date shown. Not a recommendation and not advice.
Research The Home Depot, Inc. on ValueScreener
I earn a commission if you subscribe to ValueScreener through this link.
Home Depot looked like a model grower: its dividend grew at about 13% a year over the past decade. But its 2025 raise was only 2.2%, and its 2026 raise just 1.3% (to $2.33 a quarter). Here’s what changed:
- Earnings stalled. Diluted EPS fell from $16.69 (fiscal 2022) to $14.23 (fiscal 2025).
- Leverage rose. Debt-funded acquisitions such as SRS and GMS pushed net debt/EBITDA from 1.4x to 2.7x.
- Payouts climbed. The payout ratio rose to about 71% (TIKR).
That breaks the crossover math. Against Altria, Home Depot’s yield on cost passes in about 26 years at its 5-year growth rate of 7.1%. At its recent 1–3% pace, it never does. Past dividend growth is not destiny.
Paying Too Much: Valuation Risk for Premium Growers
Quality isn’t free. Microsoft trades at about 30 times earnings and ADP at about 27 times. If their valuation multiples shrink, dividend growth alone may not deliver great total returns. Microsoft’s 0.74% yield also reflects AI investment: capital spending exceeded $100 billion in fiscal 2026, which squeezed its free cash flow yield to 1.69%.
How Market Regimes Change the Winner
| Period | What happened | Who held up better |
|---|---|---|
| 2007–09 financial crisis | Banks and cyclicals collapsed; many high yielders cut | Dividend growth (VIG –41% vs VYM –52%, peak to trough) |
| 2009–2012 recovery | Cheap value stocks rebounded hardest | High yield (rolling decades starting 2006–2009) |
| Early 2020 COVID crash | Indiscriminate selling | Dividend growth (VIG –17% vs VYM –22%, Jan–Mar) |
| 2022 rate shock | Rates surged; long-duration growth stocks fell | High yield (VYM –0.5% vs VIG –9.8%) |
| 2023–2026 | Quality and tech leadership | Dividend growth |
If interest rates stay “higher for longer,” bond-like high yielders such as telecoms and REITs face competition from cash and bonds paying 4–5%. That pressure showed up in Verizon’s and Realty Income’s flat prices over the past decade. Cheap cash generators, on the other hand, can benefit when markets rotate toward value.
Reinvest or Spend? How Your Plan Changes the Answer
If You Reinvest Dividends
If you’re reinvesting, the strategy with the higher total return builds more wealth, period. Starting yield only matters to the extent that it’s part of total return. History and our case study both favored growers here. Reinvested high yields can still produce competitive ending income, so don’t dismiss them if income is your end goal.
If You Live Off Dividends
If you spend your dividends, high yield’s head start matters more. A grower’s cumulative income may take 15–40 years to catch up. For a retiree with a 10–15-year horizon, a sustainable high yield can deliver more lifetime spending money, as long as it isn’t cut.
Also watch sequence-of-returns risk. A dividend cut early in retirement, like AT&T’s in 2022, hurts far more than one 20 years in, because you may be forced to sell shares at low prices to replace the lost income. Diversifying across 15–30 payers and keeping a cash buffer of one to two years of spending helps.
Taxes for Non-US Investors: Withholding and Estate Tax
If you live outside the United States, taxes can tilt the math against high yield:
- Withholding tax. The US withholds 30% of dividends paid to non-residents by default. Many tax treaties cut this to 15% if you file Form W-8BEN with your broker (overview). Check your own country’s treaty.
- The drag is bigger on high yield. More of a high yielder’s return arrives as taxable dividends, while a grower’s return comes more from (untaxed until sold) price gains.
| Basket (average forward yield) | Drag at 15% treaty rate | Drag at 30% statutory rate |
|---|---|---|
| Dividend growth (2.14%) | ~0.32 points/yr | ~0.64 points/yr |
| High yield (5.70%) | ~0.86 points/yr | ~1.71 points/yr |
My calculation: average forward yield × withholding rate. It ignores any foreign tax credits available in your home country.
- US estate tax. Non-US investors with more than $60,000 of US-situated assets, which includes shares of US companies, may face US estate tax filing requirements at death (IRS). Some estate tax treaties change this, so get local advice if your US holdings are large.
Dividend Growth vs High Yield: Pros and Cons
| Dividend growth | High yield | |
|---|---|---|
| Pros | Higher long-run total return (10.22%/yr for growers, 1973–2025); lower beta; smaller crash drawdowns; rising income that can beat inflation; lower tax drag | More cash today; valuation cushion (AT&T at 7.7x earnings, Verizon at 11.0x); strong in value rebounds and in 2022; reinvested yields build share count fast |
| Cons | Low starting income; premium valuations; growth can stall (Home Depot); slow to catch up for spenders; lagged in 2022 | Dividend cuts (AT&T); secular decline; high leverage; dilution (Realty Income’s share count up 3.4x since 2016); rate sensitivity; bigger tax drag; flat or falling share prices |
Which Strategy Fits You? A Decision Framework
| Your situation | Leaning | Why |
|---|---|---|
| Age 20s–40s, reinvesting, 15+ years | Mostly dividend growth (with a ~1.5–2% minimum yield) | Time lets growth compound; total return matters most |
| Age 50s, still working, 10–15 years | Blend, roughly 60/40 growth/yield | Build income while protecting growth |
| Retired, spending income now | Blend tilted to covered high yield, roughly 40/60 | Cash today matters; cut risk must be managed |
| Non-US investor, taxable account | Tilt toward growth | Withholding hits high yield harder |
| Worried about rate shocks | Include some high yield/value | Helped in 2022 |
| Worried about deep crashes | Include quality growers | Fell less in 2008 and 2020 |
Accumulators (20s–40s)
If you have decades ahead and reinvest everything, dividend growth has the stronger record. Add a minimum-yield floor of about 1.5–2% so your “dividend” portfolio doesn’t quietly become a pure growth-stock portfolio. Microsoft at 0.74% would fail that test. For a broad-index alternative, compare VOO vs QQQM.
Pre-retirees and Retirees
Income now is valuable. Favor high yielders that pass the seven warning-sign checks. For REITs, check AFFO coverage: Realty Income paid about 73% of AFFO in the first half of 2026. You can read more in our Realty Income vs VICI comparison.
The Barbell: Blending Both
In our case study, a 50/50 blend returned about 13.4% a year with reinvestment and produced $633 a year of income without it. That was more than the high-yield basket’s $528, with more starting income than the growth basket. A blend won’t top either scoreboard, but it avoids finishing last on any of them. Sample splits to consider: 70/30 growth/yield for accumulators, 50/50 for the transition years and 30/70 for income-focused retirees. For more single-stock matchups, see Coca-Cola vs PepsiCo and our best FTSE 100 dividend stocks.
How to Screen Dividend Stocks Yourself
- Set your minimum yield. For example, at least 2% for a growth tilt or at least 4% for an income tilt.
- Check dividend growth. Look at both the 5-year and 10-year growth rates, plus the most recent raise. A shrinking raise (like Home Depot’s) is an early warning.
- Check coverage. Dividends should be under about 60–75% of free cash flow, or AFFO for REITs.
- Check the balance sheet. Prefer net debt/EBITDA under about 3x for most industries.
- Check the share count. Is it falling (buybacks) or rising (dilution)?
- Check valuation. Compare today’s P/E and yield with the stock’s own 10-year history.
- Write down your thesis and the numbers that would prove it wrong, then re-check them every quarter.
Do all seven steps in one place
ValueScreener
Whether you lean toward dividend growth or high yield, build the screen around your rules, then keep checking that each stock still passes them.
- ✓Screener — Set a minimum yield, an FCF payout limit or a leverage cap, and see why each company passed.
- ✓Research — Each key figure against its peers and its own filed years, traced to the SEC filing.
- ✓Portfolio — See your growers and high yielders as one portfolio of businesses.
- ✓Theses — Write down why you own each stock; its numbers are re-tested every night, so a broken growth assumption shows up early.
Try ValueScreener → I earn a commission if you subscribe to ValueScreener through this link.
Frequently Asked Questions
Is it better to invest in dividend growth or high yield?
For long-term total return with reinvestment, history favors dividend growth. S&P 500 growers and initiators returned 10.22% a year from 1973 to 2025, and VIG beat VYM in 6 of 10 rolling decades. For maximum income in the first 10 years, a well-covered high yield pays more cash.
How long does it take for dividend growth to beat high yield?
It depends mostly on the growth gap. At past growth rates, ADP’s yield on cost passes Verizon’s in about 10 years, while Home Depot needs about 26 years to pass Altria. Cumulative income catch-up typically takes 1.5 to 2 times longer than the yield-on-cost crossover.
What is yield on cost?
Yield on cost is your current annual dividend divided by the price you originally paid. It shows how your income has grown relative to your investment. It’s not a valuation tool, though: today’s buying decisions should use today’s yield and prospects.
What is a dividend yield trap?
A yield trap is a stock with an unusually high yield because its price has fallen in anticipation of a dividend cut or business decline. Warning signs include payout above free cash flow, rising debt, shrinking revenue, rising share counts and pending deals.
Is VIG or VYM better?
From December 2006 to October 20, 2026, VIG returned 10.1% a year vs 9.2% for VYM. VIG fell less in the 2008 and 2020 crashes, while VYM held up far better in 2022. Your choice depends on whether you prioritize total return or current income.
Are high dividend stocks good for retirement?
They can be. Covered high yields provide spending cash without selling shares. Diversify across many payers, check coverage and leverage, and keep a cash buffer, because one large dividend cut early in retirement can disrupt your income plan.
Did AT&T cut its dividend?
Yes. In April 2022, AT&T reset its quarterly dividend from $0.52 to $0.2775, a 47% cut, when the WarnerMedia spin-off closed. Shareholders also received about 0.24 Warner Bros. Discovery shares per AT&T share. The dividend has stayed at $0.2775 since.
Do non-US investors pay tax on US dividends?
Usually, yes. The US withholds 30% by default, often reduced to 15% under a tax treaty if you file Form W-8BEN with your broker. High-yield portfolios lose more of their total return to withholding than dividend-growth portfolios.
Final Verdict
So, dividend growth vs high yield: which builds more wealth? On the total-wealth scoreboard, dividend growth backed by quality has the stronger long-run record. That holds in 50 years of S&P 500 data, in VIG vs VYM, and in our 2016–2026 case study. On the early-income scoreboard, a sustainable high yield wins. The ending-income scoreboard depends on whether you reinvest.
My answer: decide which scoreboard matters to you, then make the numbers prove it. Accumulators should lean toward growers with a sensible minimum yield. Income-focused investors can lean toward high yield, but only after the coverage, leverage and decline checks. And for many investors, a deliberate blend of both is the most robust design.
Next Steps
- Decide your primary goal: maximum wealth, maximum income now, or maximum income later.
- Run the crossover formula on two stocks you’re considering, using a few different growth assumptions.
- Check your current high yielders against the seven yield-trap warning signs.
- Look up each holding’s dividend record, payout vs free cash flow and leverage on ValueScreener. (I earn a commission if you subscribe to ValueScreener through this link.)
- If you invest from outside the US, confirm your treaty withholding rate and file Form W-8BEN with your broker.
Disclaimer: This article is for educational purposes only and is not financial, tax or investment advice. The 2016–2026 portfolios are hypothetical, use stocks selected with hindsight, and exclude taxes and fees. Past performance does not guarantee future results. Data as of October 20, 2026; sources are linked throughout.
For traders, not dividend investors
Trading the moves, not collecting the dividends?
Everything above is about owning shares for years and letting dividends compound. Some readers also trade shorter-term moves, such as a rate-shock rotation like 2022 or a stock’s reaction to an earnings report or a dividend announcement. If that’s you, Pepperstone offers CFDs on US shares, indices and forex.
Keep the two separate: a CFD is a leveraged bet on price. It does not give you ownership of the shares, a place on the dividend register or long-term compounding, and holding positions overnight carries financing costs. It is not a substitute for a dividend portfolio.
Learn more about Pepperstone →Affiliate link. CFDs are complex instruments and come with a high risk of losing money rapidly due to leverage. Most retail investor accounts lose money when trading CFDs. Consider whether you understand how CFDs work and whether you can afford to take the high risk of losing your money. Availability and protections depend on your country of residence.
Disclosure: The content on this page was produced with AI writing assistance under the editorial direction of a licensed Electrical Engineering practitioner and certified investor in different markets with over a decade of experience. All articles are reviewed and approved by the author before publication.
