
Quick Answer

No — copper’s 2026 rally is not a classic speculative bubble. It is a supply-driven bull market, anchored by a real mine disruption and structural electrification demand, with speculative and tariff-driven amplification on top. Prices remain vulnerable to a correction if Chinese demand stays weak or U.S. tariff policy shifts.
The Short Answer: Not Yet — But It’s Not Risk-Free Either
Copper has had one of the wildest years of any major commodity. Prices smashed record after record in early 2026, then settled into a choppy, sideways grind through the summer. If you’ve been watching the headlines, you’ve probably seen the word “bubble” thrown around a lot — usually right next to words like “record highs” and “unsustainable.”
So is the copper rally a bubble? Based on the available data, the honest answer is: not a classic speculative bubble, but not a risk-free rally either. Copper’s 2026 surge is anchored to a real, well-documented supply shock and genuine long-term demand growth — not just hype. At the same time, some bubble-adjacent warning signs have shown up this year, including heavy speculative positioning, a tariff-driven inventory distortion, and soft demand out of China. This article walks through exactly what the data says, so you can judge the risk for yourself.
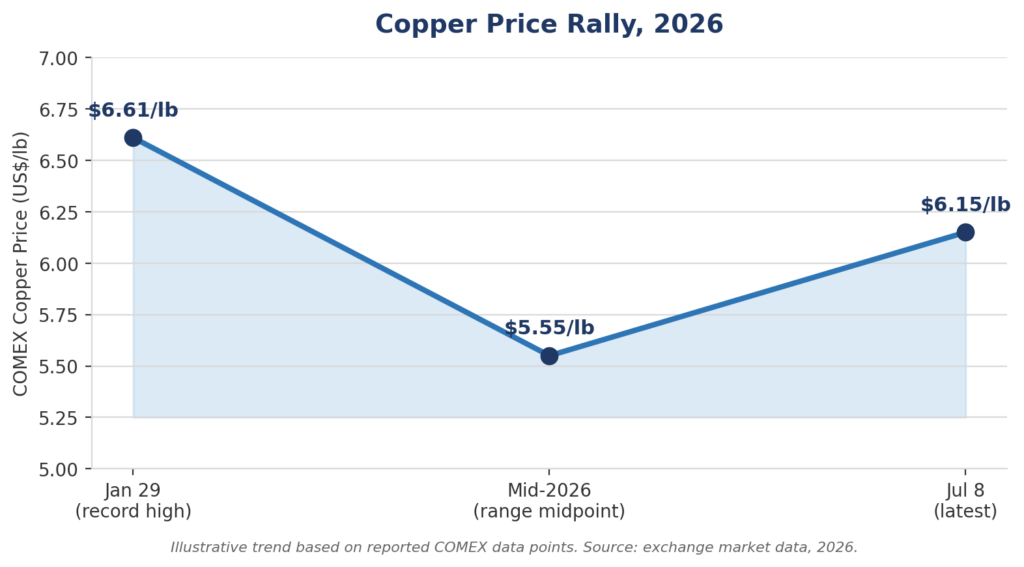
Copper price rally, 2026: record high, summer consolidation, and the latest reading. Source: exchange market data.
TL;DR: Key Takeaways
- Real supply shock: A September 2025 accident at the Grasberg mine in Indonesia — the world’s second-largest copper mine — knocked out an estimated 591,000 tonnes of output through the end of 2026.
- Real long-term demand: Electric vehicles, AI data centers, and grid modernization are structural, multi-decade demand drivers, not short-term hype.
- Some bubble warning signs exist: Heavy hedge-fund and ETF positioning, a widening COMEX–LME price gap driven by U.S. tariffs, and soft Chinese property and manufacturing demand.
- U.S. inventories are misleading: Record COMEX stockpiles reflect tariff front-running, not oversupply — global inventories outside the U.S. have actually been falling.
- Wall Street is split on price, not on the story: Goldman Sachs, J.P. Morgan, and Citi all forecast elevated 2026 prices, but their targets range widely, from about $11,400 to $14,500 per tonne — itself a sign of real uncertainty.
What Actually Makes a Market a Bubble?
Definition: What Is a Commodity Bubble?

A commodity bubble is a market where prices become detached from underlying supply and demand because investors expect future buyers to keep paying even more — not because of genuine scarcity or consumption growth. When the expectation breaks, prices can fall sharply back toward fundamentals.
Economists generally define a bubble as a market where prices become detached from underlying fundamentals because investors expect future buyers to keep paying even more — not because of genuine supply and demand.
Classic Bubble Warning Signs
- Prices rising much faster than actual demand
- Inventories building up even as prices keep climbing
- Excessive use of leverage
- Retail speculation dominating trading activity
- Valuations that depend on unrealistic future assumptions
Copper shows some of these characteristics in 2026 — but importantly, not all of them, and not uniformly across every market it trades in.
Bubble Checklist: Ask Yourself These Five Questions

1. Are prices rising much faster than actual demand?
2. Are inventories building up even as prices climb?
3. Is leverage or margin buying unusually elevated?
4. Is retail speculation dominating trading activity?
5. Do current valuations depend on unrealistic future assumptions?

If you answer “mostly no” — which is what the 2026 copper data currently shows — the rally more likely reflects fundamentals than pure speculation. The more “yes” answers accumulate, the closer a market sits to true bubble territory.
Why Copper Prices Hit Record Highs in 2026
The Grasberg Mine Disaster
The single biggest driver of the 2026 rally is a real supply shock. Freeport-McMoRan declared force majeure at its Grasberg mine in Indonesia after a fatal mud-flow accident in September 2025. Grasberg is the world’s second-largest copper mine, responsible for more than 3% of global supply. Analysts at Benchmark Mineral Intelligence estimate the disruption will remove roughly 591,000 tonnes of output through the end of 2026 — nearly a full year’s production from Collahuasi, the world’s third-largest copper mine. Freeport-McMoRan itself has said 2026 production could run about 35% below prior guidance, with a full recovery not expected until 2027.
This single event pushed Benchmark’s 2026 global refined copper deficit forecast from just 72,000 tonnes to roughly 400,000 tonnes. That’s a real, physical hole in global supply — not a speculative story.
Electrification and AI Data Center Demand
On the demand side, copper is riding several multi-decade trends at once: electric vehicles, AI data centers, grid modernization, renewable energy, and battery storage. An EV typically uses two to four times as much copper as a comparable gas-powered car, largely because of its wiring, motors, and battery systems.
AI infrastructure is a newer but fast-growing source of demand. Copper is essential for power distribution, cooling systems, networking, and transformers inside data centers. Some estimates put AI-related data center copper demand rising from roughly 110,000 tonnes in 2025 to 475,000 tonnes in 2026, and toward 330,000–420,000 tonnes annually by 2030. S&P Global forecasts total global copper demand growing from about 28 million tonnes in 2025 to more than 42 million tonnes by 2040 — a gap of roughly 10 million tonnes versus expected supply if mine investment doesn’t accelerate.
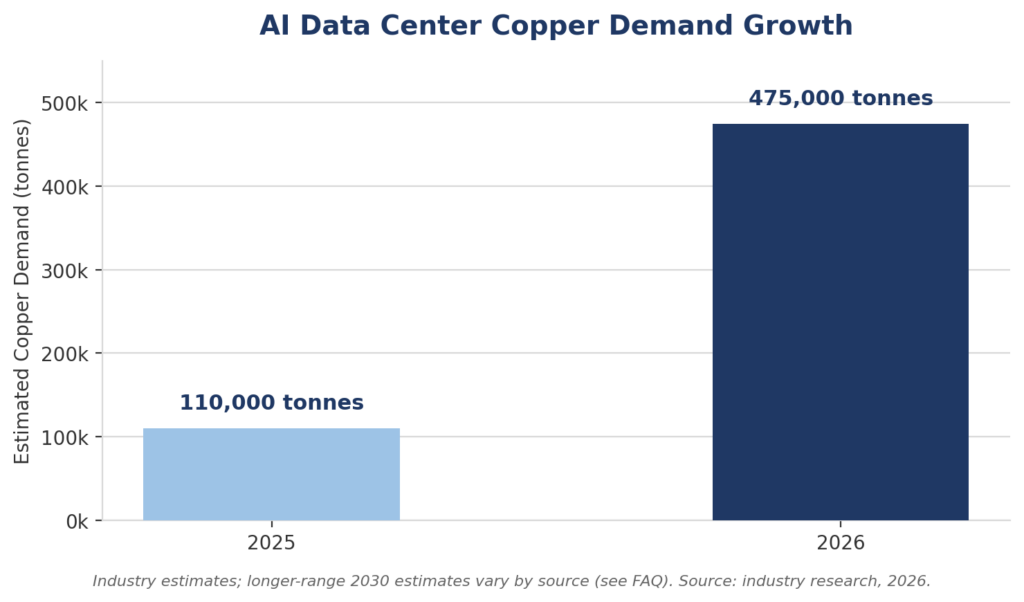
AI data center copper demand is scaling rapidly. Source: industry research, 2026.
Where Copper Demand Is Coming From

1. Electric vehicles: ~2–4x more copper per vehicle than a comparable gas-powered car
2. AI data centers: power distribution, cooling, networking, and transformers — demand estimated to rise from ~110,000 to ~475,000 tonnes, 2025 to 2026
3. Grid modernization: expanding and upgrading transmission infrastructure
4. Renewable energy & battery storage: wiring-intensive generation and storage buildout
5. Semiconductor manufacturing: additional industrial demand tied to the broader tech buildout
Tight Global Inventories — Outside the U.S.
A classic bubble warning sign is rising inventories alongside rising prices. Copper shows a more complicated picture: LME (London Metal Exchange) warehouse stocks, which reflect the global market, fell to roughly 230,000–352,000 tonnes by mid-2026, near multi-month lows. That’s consistent with real physical tightness. U.S. inventories tell a different story — more on that below.
Why Some Investors Think Copper Is a Bubble
Prices Have Outrun Near-Term Demand
Copper prices have risen much faster than global manufacturing activity in the near term. Industrial PMIs in several major economies remain mixed, and China’s property sector — historically a huge source of copper demand — has not fully recovered. China consumes roughly half of global refined copper, so its demand trajectory is arguably the single most important variable in the entire copper price story. In mid-2026, Chinese consumer spending and property/industrial utilization remained soft, creating a real disconnect between record prices and near-term physical demand from the world’s largest buyer.
Heavy Speculative Positioning
Financial investors have piled into copper in 2026. Money managers held roughly 59,132 net-long CME copper contracts at one point in 2026 — the largest bullish bet since January of that year. Mining-sector ETF assets more than doubled, from about $37 billion to $87.4 billion between Q1 2025 and Q1 2026, with $8.24 billion of fresh inflows in the first quarter of 2026 alone. Speculation doesn’t automatically create a bubble, but it can amplify price swings well beyond what physical supply and demand alone would justify.
The U.S. Tariff Distortion (COMEX vs. LME, Explained Simply)
Quick Fact: COMEX vs. LME

COMEX prices copper for delivery into U.S. warehouses; LME prices reflect the global market. In 2026, a U.S. tariff on refined copper imports pushed COMEX prices meaningfully above LME prices — a gap of roughly $300–$570 per tonne — as traders rushed metal into U.S. warehouses ahead of the tariff deadline.
One of the most important — and most misunderstood — features of the 2026 rally is the growing gap between COMEX (U.S.) copper prices and LME (global) copper prices. Here’s the plain-English version: the U.S. finalized a Section 232 tariff on refined copper imports, effective June 30, 2026, starting at 15% in January 2027 and rising to 30% in 2028. Because COMEX prices copper for delivery into U.S. warehouses, and LME prices reflect the global market, COMEX futures have priced in the coming tariff well ahead of time. That pushed traders to rush metal into U.S. warehouses to beat the tariff deadline — which is exactly why COMEX inventories hit a record ~652,200 tonnes by late June 2026, up from just ~80,000 tonnes in February 2025. The COMEX–LME spread widened to roughly $300–$570 per tonne through mid-to-late 2026 as a direct result.
This matters for the bubble question because it means the U.S. inventory build is a policy-driven stockpiling effect, not evidence of global oversupply. Read at face value, record U.S. inventories might look like a bearish, bubble-bursting signal. Read correctly, they’re a symptom of tariff timing — while the rest of the world’s inventories have actually been getting tighter.
What the Data Actually Shows
Supply Side: Genuinely Tight
Falling ore grades, aging mines, limited new discoveries, long permitting timelines, water shortages in Chile, and political uncertainty in Peru all continue to cap new supply. Large copper mines typically take 10 to 20 years from discovery to production — which is why the Grasberg outage can’t simply be replaced by ramping up output elsewhere. On the encouraging side, BHP received environmental approval in July 2026 for an expansion at its Chilean operations, an early sign that new supply is inching forward, even if it won’t arrive for years.
Demand Side: Strong Long-Term, Soft Near-Term
The long-term demand story — EVs, AI infrastructure, grid buildout, renewables — remains intact and well-documented across multiple independent research firms. The near-term picture is softer, with Chinese demand lagging the price move and industrial activity in several major economies still mixed.
Inventories: A Tale of Two Markets
This is the single most important nuance for understanding whether copper is a bubble. Aggregate global inventory figures can look reassuring, but they mask a sharp geographic split: COMEX (U.S.) stocks are at record highs because of tariff front-running, while LME (global) stocks are near multi-month lows. A reader who only sees “record copper inventories” in a headline is getting an incomplete — and potentially misleading — picture.
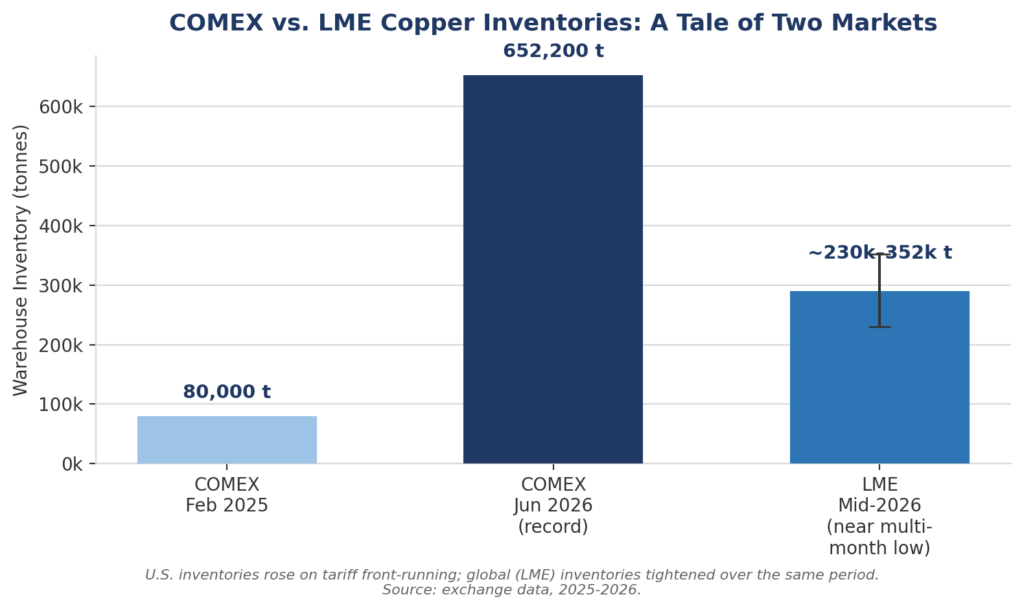
COMEX inventories hit a record on tariff front-running while LME inventories tightened over the same period. Source: exchange data, 2025–2026.
Copper Price Rally Timeline, 2026
| Period | COMEX Copper | LME Copper |
|---|---|---|
| January 29, 2026 (record high) | ~$6.61 / lb | ~$13,842.50 / tonne |
| Mid-2026 (summer consolidation) | $5.20–$5.90 / lb | $11,500–$13,000 / tonne |
| July 8, 2026 (latest) | Above $6.15 / lb | ~$13,090 / tonne |
Source: exchange market data, 2026.
Copper 2026 vs. the 2008 Commodity Bubble
One useful way to judge the bubble question is to compare today’s rally against a market that everyone agrees was a genuine speculative bubble: the 2008 commodity boom.
| Factor | 2008 Commodity Bubble | Copper in 2026 |
|---|---|---|
| Strong speculative buying | Yes | Moderate |
| Tight physical supply | Mixed | Yes |
| Structural demand growth | Limited | Strong |
| Inventory shortages | Mixed | Yes (outside the U.S.) |
| Long-term demand visibility | Weak | Strong |
| Heavy retail speculation | High | Lower |
| Supply constrained by permitting | Moderate | High |
Overall, today’s rally appears to rest on firmer structural fundamentals than the commodity boom leading into 2008.
What Wall Street Is Forecasting
Major banks broadly agree the medium-term structural story is intact, but their price targets diverge meaningfully — itself a sign of real uncertainty rather than consensus complacency.
| Bank | 2026 Forecast | Key View |
|---|---|---|
| Goldman Sachs | ~$11,400–$13,349 / tonne (revised higher through the year) | Tighter global balances and strong U.S. imports; warns record prices may not fully hold |
| J.P. Morgan | ~$12,075–$12,500 / tonne | Structural deficits supportive, but geopolitical/macro risks could add volatility |
| Citi | Near-term call as high as $14,500 / tonne | Expects summer softness, with bullish catalysts re-emerging later in 2026 |
That roughly $11,400–$14,500 per tonne range across three major banks is a useful data point in its own right: it tells you the market is genuinely uncertain about how tariffs, Grasberg’s recovery timeline, and Chinese demand will resolve — not that everyone is pricing in the same rosy outcome.
Important Statistics & Supporting Data
| Metric | Figure | Source |
|---|---|---|
| Grasberg lost output (Sept 2025–end 2026) | ~591,000 tonnes | Benchmark Mineral Intelligence |
| Revised 2026 global refined copper deficit | ~400,000 t (up from 72,000 t) | Benchmark Mineral Intelligence |
| COMEX inventories, late June 2026 (record) | ~652,200 tonnes | Exchange data |
| COMEX inventories, February 2025 | ~80,000 tonnes | Exchange data |
| LME inventories, mid-2026 | ~230,000–352,000 t (multi-month low) | Exchange data |
| COMEX–LME price spread, mid/late 2026 | ~$300–$570 / tonne | ING, TradingKey |
| U.S. Section 232 copper tariff | 15% from Jan 2027, rising to 30% in 2028 | U.S. trade policy |
| Money-manager net-long CME copper contracts (2026 peak) | ~59,132 contracts | CFTC-based commentary |
| Mining ETF AUM growth (Q1 2025 → Q1 2026) | $37B → $87.4B | ETFGI |
| Global copper demand, 2025 → 2040 (forecast) | ~28M → 42M+ tonnes | S&P Global |
| EV copper use vs. gas-powered vehicle | ~2–4x | Industry estimates |
| AI data center copper demand, 2025 → 2026 | ~110,000 → 475,000 tonnes | Industry estimates |
Warning Signs Worth Watching
Quick Fact: Why Is Copper Called “Dr. Copper”?

Copper is nicknamed “Dr. Copper” because its price has historically tracked global industrial activity closely — it’s used across construction, manufacturing, power, and transportation, so demand for it rises and falls with the broader economy.
- Global or Chinese recession: Copper is nicknamed “Dr. Copper” for its sensitivity to industrial activity; a significant slowdown would hit demand directly.
- Faster Grasberg recovery: If Freeport-McMoRan restarts operations ahead of the 2027 timeline, the supply deficit could narrow quickly.
- New mine supply: Projects like BHP’s Chilean expansion could add supply sooner than currently priced in, though large projects still take years.
- Unwind of speculative positioning: Record hedge-fund net-long positions and ETF inflows could reverse sharply if macro data disappoints.
- Demand substitution: High prices are already encouraging manufacturers to substitute aluminum for copper in power transmission, construction, and some automotive applications.
- Tariff policy changes: Any delay, reduction, or removal of the U.S. copper tariff could quickly collapse the COMEX–LME spread and trigger a wave of destocking from the record U.S. inventory pile.
Frequently Asked Questions
Is copper in a bubble in 2026?
The data shows real supply tightness and structural demand growth, not just speculation. Most analysts describe this as a fundamentally supported rally with speculative amplification, rather than a classic bubble.
Why did copper hit record highs in 2026?
A combination of factors: the September 2025 Grasberg mine disaster removing a major source of global supply, tariff-driven stockpiling into U.S. warehouses, record Chinese investor buying, a weaker U.S. dollar, and growing AI and data-center demand.
Why are U.S. copper prices higher than London prices?
Because of the finalized U.S. Section 232 tariff on refined copper imports (15% starting January 2027, rising to 30% in 2028). Traders have been shipping metal into U.S. warehouses ahead of the tariff, creating a persistent COMEX premium over LME that reflects U.S. policy — not global scarcity alone.
Could copper prices crash?
Yes. Key triggers would include a global growth slowdown, continued Chinese property and manufacturing weakness, a faster-than-expected resumption of Grasberg output, new mine supply arriving early, or a rapid unwind of speculative and ETF positioning.
How much copper does an EV use compared to a gas car?
Roughly two to four times as much, driven primarily by wiring, batteries, and electric motors.
How much copper will AI data centers use?
Estimates vary, but AI-related data center copper demand could climb from roughly 110,000 tonnes in 2025 to 475,000 tonnes in 2026, and toward 330,000–420,000 tonnes annually by 2030 on some estimates.
What do major banks forecast for copper prices?
Estimates for 2026 range roughly from $11,400 to $14,500 per tonne across Goldman Sachs, J.P. Morgan, and Citi — reflecting genuine uncertainty about how tariffs, Grasberg’s recovery, and Chinese demand will play out.
Bottom Line: Is Copper a Bubble?
The evidence does not strongly support the idea that copper is in a classic speculative bubble. Instead, the 2026 rally looks like a combination of genuine supply shortages (led by the Grasberg disaster), multi-year electrification and AI-infrastructure demand, tariff-related market distortions, and additional speculative buying that has amplified the move.
That combination makes copper vulnerable to a correction if economic growth disappoints, Chinese demand stays weak, or policy changes shift the tariff picture. But unlike many historical bubbles, today’s elevated prices still have substantial support from underlying supply-and-demand fundamentals — they’re not simply a story of buyers hoping the next buyer pays more.
Next Steps for Investors: A 4-Step Monitoring Checklist
If you’re following the copper story, the data suggests a few specific things worth tracking rather than trying to time a single “bubble or not” verdict:
- Watch LME inventories, not just COMEX: A sustained rise in global (non-U.S.) inventories alongside rising prices would be the clearest bubble warning sign.
- Track Grasberg’s recovery timeline: Faster-than-expected restart news would be the single biggest bearish catalyst for prices.
- Follow Chinese PMI and property data: As roughly half of global demand, China’s recovery (or lack of one) will heavily influence whether current prices hold.
- Monitor speculative positioning: Sharp reversals in hedge-fund net-long positions or ETF flows can signal a sentiment shift before prices move.
For investors who want to track these data points in real time — live COMEX and LME copper prices, inventory charts, and positioning data — charting platforms like TradingView offer free tools built for exactly this kind of monitoring. Those interested in trading copper futures or CFDs directly should also understand the added volatility and risk involved; brokers such as Pepperstone provide educational resources on commodity trading, though any leveraged position in a market this volatile should be sized carefully.
Related reading: Is the AI Chip Rally Over? What the July 2026 Selloff Really Showed | Understanding High-Bandwidth Memory (HBM) and the AI Chip Supply Chain | Tesla vs. BYD: Comparing the World’s Biggest EV Makers
Disclosure: The content on this page was produced with AI writing assistance under the editorial direction of a licensed Electrical Engineering practitioner and certified investor in different markets with over a decade of experience. All articles are reviewed and approved by the author before publication.