
Realty Income vs VICI is one of the most common match-ups income investors look at, and for good reason. Both are large US real estate investment trusts (REITs). Both lease buildings to tenants on long contracts. Both have paid rising dividends for years. On the surface, they look like substitutes.
They aren’t. One owns more than 15,000 properties leased to almost 1,800 businesses. The other owns about 100 properties, and two casino companies pay roughly 70% of its rent. One pays you every month. The other pays four times a year, but pays a lot more.
As an engineer, I like to break a decision like this into measurable parts. So in this article we’ll compare the two REITs on yield, safety, growth, valuation, diversification and volatility, using dated numbers from company filings. Then we’ll look at who each one suits, and whether owning both makes sense.
Realty Income vs VICI: The Short Answer
VICI pays more and trades cheaper. It yields about 7.9% against Realty Income’s 5.8%, at about 9.5 times AFFO against 12.7 times. Realty Income is the safer, steadier choice. It has far more tenants, an A-range credit rating and lower volatility, but its dividend growth has slowed to under 1% a year. Both pay out about 75% of AFFO. For many income investors, owning both is a reasonable middle path.
Key Takeaways
- Only Realty Income (O) pays monthly. VICI Properties pays quarterly. On October 20, 2026, VICI yielded about 7.9% and O about 5.8%.
- The payout ratios are nearly identical. O pays out about 73% of its 2026 guided AFFO and VICI about 75%. VICI’s higher yield comes from its lower valuation, not from a stretched payout.
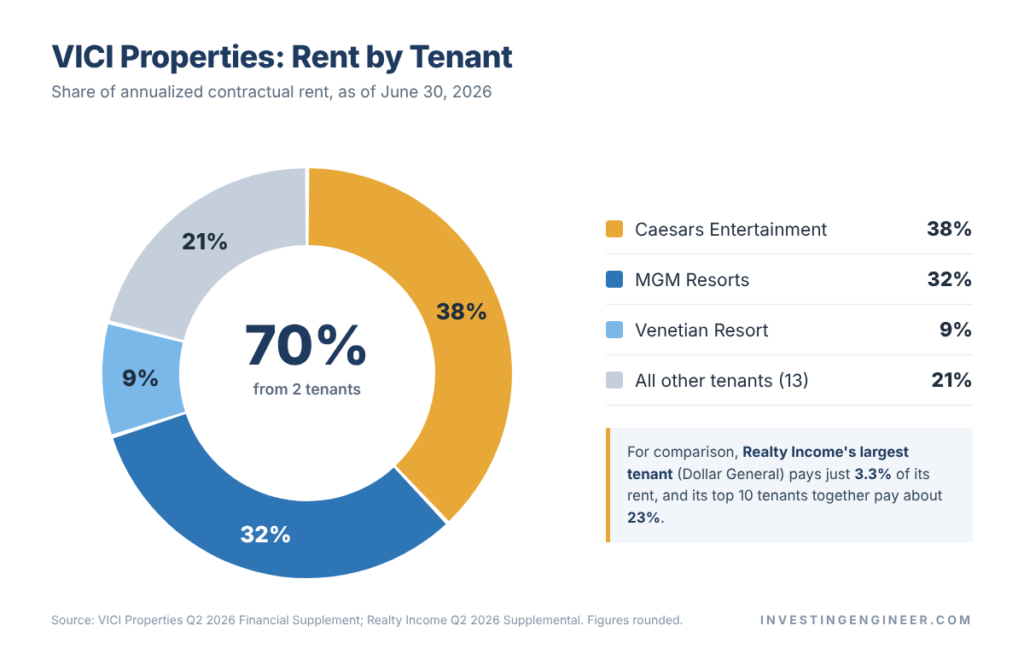
- Diversification is the big difference. O’s largest tenant is 3.3% of its rent. At VICI, Caesars (38%) and MGM (32%) supply about 70%.
- Both dividends are growing more slowly. VICI’s latest raise was 2.2%, its smallest ever. O’s monthly dividend rose less than 1% over the past year.
- Caesars is VICI’s swing factor. Caesars is being acquired by Fertitta Entertainment, and analysts have questioned whether its regional lease rent is sustainable.
- Owning both has smoothed the ride. From December 2020 to October 2026, a 50/50 mix returned about the same as either REIT, with a smaller maximum drawdown (−23% vs −32% for O and −26% for VICI).
Realty Income vs VICI at a Glance (October 2026)
| Metric | Realty Income (O) | VICI Properties (VICI) |
|---|---|---|
| Share price | $56.34 | $23.37 |
| Market cap | $53.3 billion | $25.7 billion |
| Dividend frequency | Monthly | Quarterly |
| Current dividend | $0.2715/month ($3.258/yr) | $0.46/quarter ($1.84/yr) |
| Dividend yield | 5.8% | 7.9% |
| 2026 AFFO guidance (per share) | $4.44–$4.45 | $2.45–$2.47 |
| Price to AFFO | 12.7x | 9.5x |
| AFFO payout ratio | ~73% | ~75% |
| Price to book | 1.30x | 0.89x |
| Properties / tenants | 15,588 / 1,798 | 103 / 16 |
| Largest tenant (share of rent) | Dollar General (3.3%) | Caesars (38%) |
| Credit rating (S&P) | A- | BBB- |
| Beta vs S&P 500 (2-year) | 0.17 | 0.30 |
Data: ValueScreener’s O and VICI reports, built from SEC filings, as of the October 20, 2026 close. AFFO, tenant and debt figures are from each company’s Q2 2026 supplemental. Price to AFFO and payout ratio use the guidance midpoint. (I earn a commission if you subscribe to ValueScreener through this link.)
What Do Realty Income and VICI Actually Own?
Before comparing numbers, it helps to picture the businesses. Both are net-lease REITs. In a net lease (often “triple-net”), the tenant pays the property taxes, insurance and maintenance. The landlord mostly just collects rent, which makes the income predictable.
Realty Income: 15,588 Properties, 1,798 Tenants
Research Realty Income Corporation on ValueScreener
I earn a commission if you subscribe to ValueScreener through this link.
Realty Income calls itself “The Monthly Dividend Company.” It owns 15,588 properties across the US, the UK and Continental Europe, leased to 1,798 clients. Occupancy is 98.8%.
About 78% of its rent comes from retail, mainly convenience stores, dollar stores, grocers and home-improvement chains that hold up well in recessions. Another 16% comes from industrial buildings, and about 3% from gaming. Its biggest tenant, Dollar General, pays just 3.3% of total rent. Its top 20 tenants together pay about 35%.
About 20.5% of rent comes from outside the US (15.0% UK, 5.5% Continental Europe). Realty Income is also expanding into data centers through a $6 billion hyperscale joint venture.
VICI Properties: Casinos, Experiences and Very Long Leases
Research VICI Properties Inc. on ValueScreener
I earn a commission if you subscribe to ValueScreener through this link.
VICI was spun out of Caesars Entertainment’s bankruptcy in 2017. Today it’s the largest owner of casino real estate in the US. It owns the buildings under Caesars Palace, MGM Grand, the Venetian Resort and dozens of regional casinos, plus “experiential” assets like Chelsea Piers, Lucky Strike bowling centers and a Club Med resort.
It owns 103 properties with 100% occupancy. Most are rented through master leases. A master lease is one contract covering many properties, so a tenant can’t hand back a weak casino and keep the strong ones. VICI’s weighted average lease term, including renewal options, is 39.6 years, compared with 8.6 years at Realty Income.
VICI also runs a growing loan book: about $3.0 billion lent to developers and operators at a blended 9.4% interest rate.
Dividend Yield and Payout Frequency
Does VICI Pay Monthly Dividends?
No. VICI pays quarterly, usually in January, April, July and October. Realty Income pays monthly and has done so for 675 consecutive months.
Payment frequency doesn’t change how much you earn in a year. It only changes when the cash arrives. Monthly income can make budgeting easier, especially in retirement, but it isn’t extra money.
What $10,000 Pays You in Each REIT
Here’s what a $10,000 investment would pay at current dividend rates and October 20 prices.
| Holding | Annual income (gross) | Per payment | After 15% withholding† | After 30% withholding† |
|---|---|---|---|---|
| $10,000 in O | ~$578 | ~$48 per month | ~$492 | ~$405 |
| $10,000 in VICI | ~$787 | ~$197 per quarter | ~$669 | ~$551 |
| $5,000 in each | ~$683 | Monthly + larger quarterly | ~$580 | ~$478 |
† For investors outside the US. The rate depends on your country’s tax treaty with the US: 30% is the default without a treaty, and many treaties reduce it. See the international section below.
VICI’s extra 2.1 percentage points of yield add about $209 a year per $10,000. Whether that’s worth it depends on the risks we cover next.
Dividend Safety: Payout Ratios and Balance Sheets
AFFO Payout Ratio: Almost Identical
For REITs, the best measure of dividend-paying ability is AFFO (adjusted funds from operations). AFFO takes net income, adds back depreciation on buildings, and strips out other non-cash items. It’s the closest thing a REIT has to “cash earnings.”
- Realty Income: $3.258 annual dividend ÷ $4.445 guided AFFO = about 73% (the company reported 73.0% for Q2 2026).
- VICI: $1.84 annual dividend ÷ $2.46 guided AFFO = about 75%.
This is the most important point in the whole comparison. VICI’s higher yield doesn’t come from paying out more of its cash flow. Both REITs keep about a quarter of their AFFO to reinvest. VICI yields more because its share price is lower relative to its cash flow. In other words, the market is charging a risk discount, and that risk is mainly about tenants, which we’ll get to shortly.
Debt, Credit Ratings and Interest Costs
| Balance sheet (June 30, 2026) | Realty Income | VICI |
|---|---|---|
| Total debt | ~$31.0 billion | ~$17.2 billion |
| Net debt / adjusted EBITDA | 5.4x | 4.9x |
| Weighted average interest rate | 3.8% | 4.45% (effective) |
| Average years to maturity | 5.1 | 5.5 |
| Credit ratings (Moody’s / S&P / Fitch) | A3 / A- / A | Baa3 / BBB- / BBB- |
Realty Income has one of the strongest credit ratings in the REIT sector, which lets it borrow more cheaply. VICI is investment grade, but at the lowest rung. VICI actually carries slightly less debt relative to its earnings (4.9x vs 5.4x). Its lower rating reflects its tenant concentration rather than excessive borrowing.
Tip: Some data sites show Realty Income’s total debt as about $1 billion. That figure comes from incomplete balance-sheet data. The company’s own supplemental shows about $31 billion.
Dividend Growth: Who Raises Faster, and Is It Slowing?
Over five years, VICI has clearly grown its dividend faster. Look closely at the recent raises, though, and both companies are slowing.
| Year | VICI quarterly dividend (raise) | Realty Income monthly dividend (Sept) |
|---|---|---|
| 2021 | $0.36 (+9.1%) | $0.2360 |
| 2022 | $0.39 (+8.3%) | $0.2480 |
| 2023 | $0.415 (+6.4%) | $0.2560 |
| 2024 | $0.4325 (+4.2%) | $0.2630 |
| 2025 | $0.45 (+4.0%) | $0.2690 |
| 2026 | $0.46 (+2.2%) | $0.2715 (+0.9%) |
| 5-year growth rate | ~5.0% per year | ~2.8% per year |
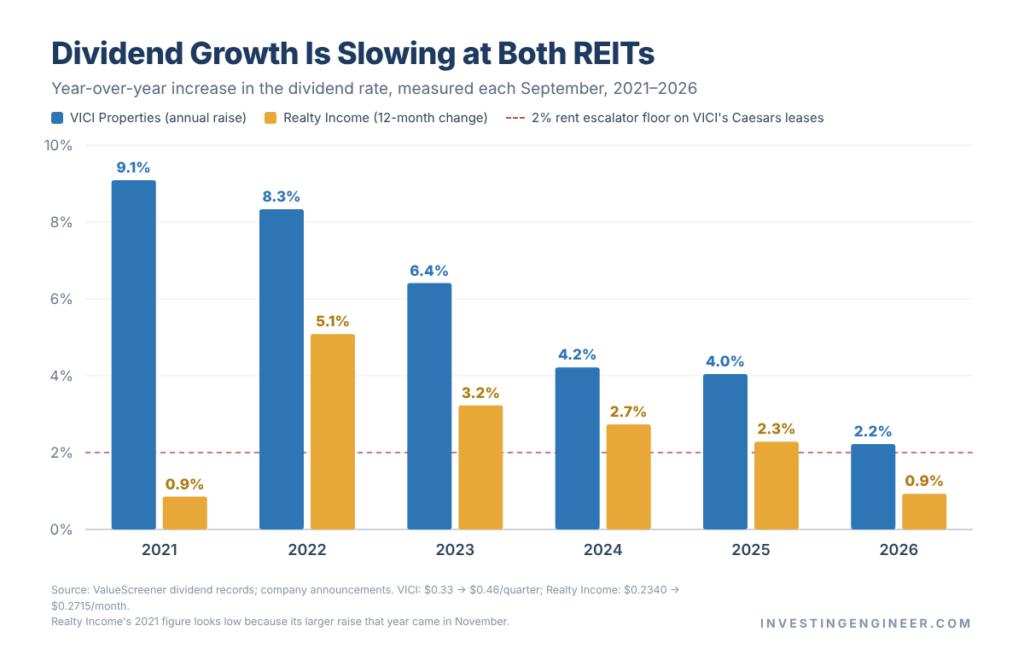
VICI raises once a year, in September. Its 2026 raise of 2.2% was its smallest since it started paying dividends, and close to the 2% minimum rent escalator in many of its leases.
Realty Income raises in small steps several times a year. The September 2026 increase was its 136th since listing in 1994, and it has raised its dividend for more than 31 consecutive years. But each step is now tiny ($0.0005 a month), and the monthly rate rose under 1% over the past 12 months.
Why so slow, when Realty Income expects AFFO to grow about 4% in 2026? Its growth model depends on buying properties at yields above its cost of capital. With its share price down and Treasury yields above 5%, that spread is thin. Management appears to be keeping a wider cushion rather than pushing the payout higher. The dividend still looks safe. It just isn’t growing much right now.
Want to see every raise yourself? ValueScreener shows each company’s full dividend record, with every declaration, ex-date and payment date. You can spot a slowdown like this one as it happens instead of reading about it a year later. (I earn a commission if you subscribe to ValueScreener through this link.)
Valuation: Is VICI Really Cheaper?
Why P/E Doesn’t Work for REITs
If you look up Realty Income’s P/E ratio, you’ll see something like 48x, which sounds expensive. That number is misleading. Accounting rules make REITs deduct depreciation on their buildings every year, even though well-located real estate often holds or gains value. This depresses reported earnings. That’s why analysts value REITs on price to AFFO (or FFO) instead.
Price to AFFO and Price to Book
| Valuation (Oct 20, 2026) | Realty Income | VICI |
|---|---|---|
| Price to 2026 AFFO | 12.7x | 9.5x |
| AFFO yield (AFFO ÷ price) | 7.9% | 10.5% |
| Price to book | 1.30x | 0.89x |
| Price to operating cash flow (FY2025) | 12.8x | 9.9x |
On every measure, VICI is cheaper. It even trades below its book value, meaning the market values its equity at less than its accounting value.
Cheap isn’t automatically good. A low multiple can be a bargain, or it can be the market correctly pricing in a problem. For VICI, the market is pricing in a specific worry, and it has a name: Caesars.
Tenant Concentration: VICI’s Caesars Question
What Is Happening With Caesars and Fertitta?
Caesars pays about 38% of VICI’s rent across two master leases. Two things are going on.
1. The regional lease is tight. The Caesars Regional Master Lease covers 16 regional casinos and pays about $740 million a year in rent. In December 2025, J.P. Morgan analyst Daniel Politzer estimated those casinos generate about $750 million of cash flow before rent. That would leave Caesars with very little cushion. He said “a rent reduction and/or less onerous escalator is a possibility.” Several brokers, including Wells Fargo, Evercore ISI, Barclays and Scotiabank, downgraded VICI or cut their price targets over this risk between late 2025 and early 2026.
2. Caesars is being sold. On May 28, 2026, Fertitta Entertainment agreed to buy Caesars for $31 per share in cash, a deal valued at about $17.6 billion including debt. It still needs shareholder and gaming-regulator approval, which could take more than a year. VICI would continue to own the real estate, but as of mid-October 2026, reports say the lease terms under new ownership weren’t final.
What it means for you: As of October 2026, rent is still being paid in full under the existing leases, and no rent cut has been agreed. But if a deal lowers the regional rent or softens future rent increases, VICI’s AFFO growth, and possibly its dividend growth, would take a hit. That uncertainty is a big part of why VICI trades at 9.5x AFFO.
MGM, VICI’s second-largest tenant at 32%, adds another layer of concentration. Its Las Vegas properties are generally considered strong assets, but with only 16 tenants in total, VICI’s fortunes are tied to a handful of casino operators.
How Exposed Is Realty Income to Any Single Tenant?
Very little. Its largest tenant pays 3.3% of rent, and about 34% of its rent comes from investment-grade tenants. A single bankruptcy would be a small blip.
Realty Income’s risks are more spread out. Its watch list of shakier tenants is elevated at about 5% of rent (mainly home furnishings and casual dining), and expected credit losses (about 0.4% of rent) are above its historical average. These are manageable issues, not existential ones.
Performance and Volatility: What the Last Five Years Show
| Total return, Dec 31, 2020 – Oct 20, 2026 | Realty Income | VICI | 50/50 mix |
|---|---|---|---|
| Total return (dividends reinvested) | +25.2% | +25.3% | +26.9% |
| Annualized return | ~3.9% | ~3.9% | ~4.2% |
| Annualized volatility | 20.0% | 19.3% | 18.5% |
| Maximum drawdown (month-end) | −31.8% | −26.2% | −22.8% |
| 2026 year to date | +4.0% | −12.5% | — |
Source: computed from Alpha Vantage monthly adjusted prices (dividends reinvested). The 50/50 mix is rebalanced monthly. Past performance doesn’t predict future returns.
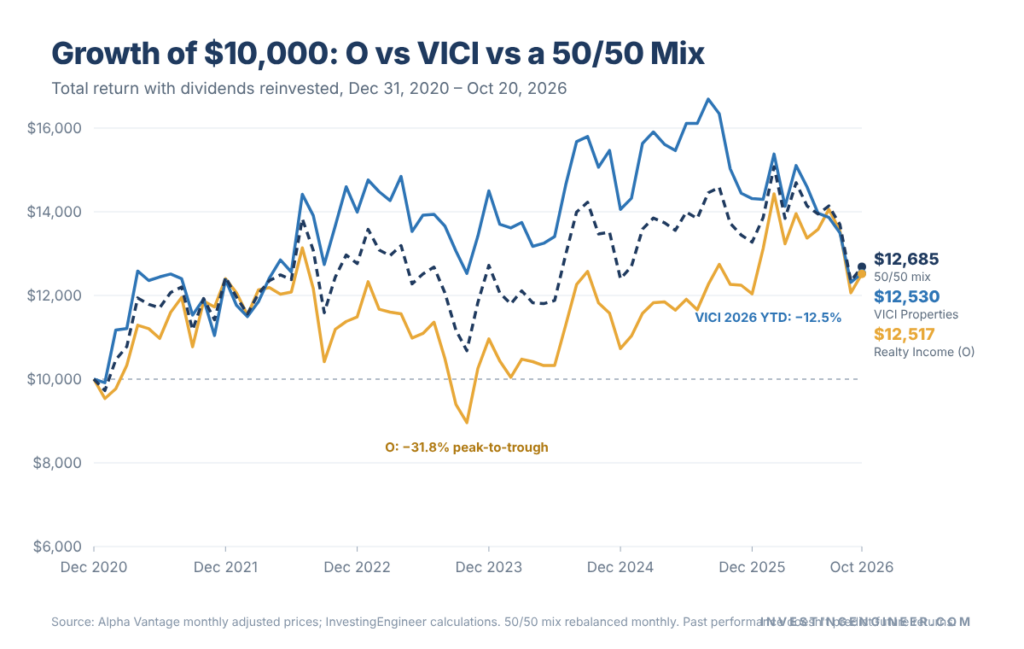
Over almost six years, the two REITs ended in nearly the same place: about 25% total return, or roughly 3.9% a year. That’s modest, and it reflects one of the worst interest-rate environments for REITs in decades.
Test Realty Income vs VICI From Your Own Start Date
From 2020, the two REITs finished almost level. From the start of 2026, Realty Income is well ahead. Plot O and VICI on one chart, switch to percentage view, and move the start date around. You’ll see how much the “winner” depends on when you begin. It’s also an easy way to watch how each stock reacts to its Q3 report (VICI on October 28, Realty Income on November 2).
Compare O vs VICI on TradingView →Affiliate link. We may earn a commission at no extra cost to you.
Why Both REITs Fell in 2026
The 10-year US Treasury yield rose from about 4.7% in August to about 5.3% in early October 2026, its highest level since 2007. When safe government bonds pay over 5%, a 5.8% REIT yield looks much less attractive, so REIT prices fall until yields rise to compensate.
Realty Income fell from about $66 in July to the mid-$50s. Scotiabank downgraded it in September, citing its above-average sensitivity to interest rates. VICI has fallen further in 2026 (about −12.5% including dividends), as rate pressure added to the Caesars uncertainty.
What Happens If You Own Both?
Here’s the interesting part. A 50/50 mix had lower volatility and a smaller drawdown than either REIT alone. The two stocks move together, but not perfectly: their monthly correlation was 0.76. Their worst stretches came at different times. Realty Income’s came during the 2022–2023 rate hikes, while VICI’s biggest drop has come in 2026.
Engineer’s Note: Think of it like running two pumps in parallel instead of one. Each pump has its own failure modes. Running both doesn’t double your output, but it makes the system much less likely to go dry at the worst moment. Owning both REITs gave a blended yield of about 6.8% with a smoother ride than either alone.
Pros and Cons
Realty Income (O)
Pros:
- Monthly dividends with a 31-year record of increases
- 15,588 properties and 1,798 tenants, with no tenant above 3.3% of rent
- A-range credit rating and low borrowing costs (3.8% average)
- Lowest volatility of the two (beta 0.17)
Cons:
- Lower yield (5.8%)
- Dividend growth has slowed to under 1% a year
- Highly sensitive to interest rates
- Still issuing shares to fund growth (+5.2% share count in 2025)
- Currency exposure from UK and European properties
VICI Properties (VICI)
Pros:
- Higher yield (7.9%) with a comparable ~75% payout ratio
- Cheaper valuation (9.5x AFFO, below book value)
- Very long master leases with CPI-linked rent increases (2% floor on Caesars leases)
- Little dilution (+1.4% share count in 2025)
- 100% occupancy
Cons:
- About 70% of rent from Caesars and MGM
- Caesars lease uncertainty during the Fertitta takeover
- Smallest-ever dividend raise in 2026 (2.2%)
- Lower credit rating (BBB-)
- Quarterly, not monthly, payments
Which REIT Fits Which Investor?
| If you… | Lean toward | Why |
|---|---|---|
| Want maximum current income | VICI | ~7.9% yield vs ~5.8% |
| Rely on monthly cash flow for bills | Realty Income | Pays every month |
| Can’t stomach a single-tenant shock | Realty Income | No tenant above 3.3% of rent |
| Are a value investor comfortable with event risk | VICI | 9.5x AFFO, below book value |
| Want the steadiest ride | Realty Income or a mix | Lowest beta; mix had smallest drawdown |
| Want a balance of yield and safety | Both (e.g., 50/50) | ~6.8% blended yield, historically smoother returns |
Your choice should depend on your income needs, your other holdings and how much concentration risk you’re comfortable with. If you already own casino or gaming stocks, for example, VICI adds more of the same exposure.
What to Watch in Q3 2026 Earnings
Earnings Watch
VICI: Wednesday, October 28, 2026 (after the close; call October 29 at 10:00 a.m. ET)
• Any update on Caesars lease talks or the Fertitta deal
• Whether 2026 AFFO guidance ($2.45–$2.47) holds
• New investments that reduce dependence on Caesars and MGM
Realty Income: Monday, November 2, 2026 (after the close; call 2:00 p.m. PST)
• 2026 AFFO guidance ($4.44–$4.45) and any early 2027 outlook
• Investment spreads with Treasury yields above 5%
• Watch-list and credit-loss trends
The numbers in this article are as of October 20, 2026. Both reports could change the picture, so check for updates after each release.
For International Investors: Taxes and Access
If you live outside the US, dividends from US REITs are taxed at source before they reach you.
- Default rate: The US withholds 30% on dividends paid to non-US investors unless a tax treaty lowers it.
- Treaty rates: Many countries have treaties that reduce the rate on REIT dividends, often to 15–25%, though REIT dividends sometimes get less relief than ordinary dividends. To claim the treaty rate, you usually file a W-8BEN form with your broker. Nareit’s withholding table lists the rate for each country.
- Local taxes: Your home country may also tax foreign dividends, often with a credit for US tax already withheld. Check with a local tax adviser.
- Tax-advantaged accounts: Some accounts and pension schemes have special treatment. UK investors, for example, should check how US REIT dividends are handled in an ISA or SIPP.
- Access: You’ll need a broker that offers US stocks. Large international brokers such as Interactive Brokers serve clients in many countries, and app-based platforms are another option. See our GoTrade review, and always confirm current availability in your country.
Because withholding takes the same share of both dividends, it doesn’t change which REIT yields more. VICI still pays about 36% more income per dollar invested.
How to Compare REITs Yourself
Numbers like these change every day, so it’s worth learning to check them yourself. Here’s the process I used for this article:
- Check the current dividend rate, not last year’s total. Calendar-year totals can be distorted when payment dates cross year-end.
- Calculate the AFFO payout ratio. Divide the annual dividend by the company’s AFFO guidance (found in its quarterly supplemental).
- Look at the top-tenant list. Ask what happens if the largest tenant cuts rent by 10–20%.
- Check credit ratings and the debt maturity schedule.
- Compare price to AFFO, not P/E.
- Read the dividend history raise by raise to see whether growth is speeding up or slowing down.
Run this REIT checklist in minutes, not hours
Most of the figures in this article came from ValueScreener, which traces every number back to the SEC filing it came from. Open the full Realty Income and VICI reports, read each company’s complete dividend record, and set an alert if, say, VICI’s yield moves above 8.5% or Realty Income’s drops below 5.5%.
See the O and VICI reports → I earn a commission if you subscribe to ValueScreener through this link.
Frequently Asked Questions
Is VICI better than Realty Income?
Neither is better for everyone. VICI offers a higher yield (about 7.9%) and a cheaper valuation. Realty Income offers far more diversification, a stronger credit rating and monthly payments. Both pay out about 75% of AFFO.
Does VICI pay monthly dividends?
No. VICI pays quarterly, usually in January, April, July and October. Realty Income is the one that pays monthly.
Is VICI’s dividend safe?
Its payout ratio of about 75% of 2026 guided AFFO is similar to Realty Income’s. The bigger risk is concentration: Caesars and MGM pay about 70% of its rent, and the Caesars regional lease is under scrutiny during Fertitta’s takeover.
Why is Realty Income stock down in 2026?
Mainly because of rising interest rates. The 10-year Treasury yield climbed above 5% in September and October 2026, making bonds more competitive with REIT dividends. Scotiabank also downgraded the stock in September, citing rate sensitivity and slower FFO growth.
Who is VICI’s biggest tenant?
Caesars Entertainment, at about 38% of annualized rent, followed by MGM Resorts at about 32% and the Venetian Resort at about 9%.
Can I own both Realty Income and VICI?
Yes. From December 2020 to October 2026, a 50/50 mix delivered a slightly higher return than either REIT alone, with lower volatility and a smaller maximum drawdown. Past results don’t guarantee future ones.
How much tax do non-US investors pay on US REIT dividends?
The default US withholding rate is 30%. Many countries’ tax treaties reduce it, and you usually need to file a W-8BEN form with your broker to claim the lower rate. Check Nareit’s withholding table for your country.
The Bottom Line
In the Realty Income vs VICI debate, the real trade-off isn’t monthly versus quarterly. It’s diversification and predictability versus yield and valuation.
Realty Income is the sleep-well-at-night option. It has thousands of tenants, an A-rated balance sheet and a monthly cheque. The price is a lower yield and dividend growth that has nearly stopped for now. VICI pays you about 36% more income and trades at a deep discount, but you’re making a concentrated bet on a few casino operators at a moment when its biggest tenant is changing hands.
Both pay out about three-quarters of their cash flow, so neither dividend looks stretched today. And because their worst periods haven’t lined up, owning both has historically produced a smoother result than picking just one.
Whatever you choose, re-check the numbers after VICI reports on October 28 and Realty Income on November 2.
Next Steps
1. Check the live numbers
Yields and valuations move every day. See current figures and full dividend records for both REITs.
Open ValueScreener →I earn a commission if you subscribe to ValueScreener through this link.
2. Chart the earnings reaction
Watch how O and VICI trade after their Q3 reports on October 28 and November 2.
Open TradingView →Affiliate link. We may earn a commission at no extra cost to you.
- Compare with dividend ETFs: Read our SCHD vs VYM dividend ETF comparison to see how a diversified fund stacks up against individual REITs.
- Explore more income ideas: See our guides to UK dividend stocks for passive income and which oil major has the better dividend.
Disclaimer: This article is for educational purposes only and isn’t financial, investment or tax advice. The author isn’t a licensed financial adviser. Figures are as of October 20, 2026 unless stated otherwise and may have changed. Do your own research and consider consulting a licensed professional before investing.
Disclosure: The content on this page was produced with AI writing assistance under the editorial direction of a licensed Electrical Engineering practitioner and certified investor in different markets with over a decade of experience. All articles are reviewed and approved by the author before publication.
