These 2 Powerful Balance Sheet Ratios Will Help You Determine A Company’s Financial Health

In this tutorial, I’ll teach you two Balance Sheet ratios I use and how important it is to determine a company’s financial health. These 2 ratios are Current Ratio and Debt To Equity Ratio.
But first, let me discuss some of the important balance sheet terminologies that you need to learn in order to understand the basic concept of these ratios.
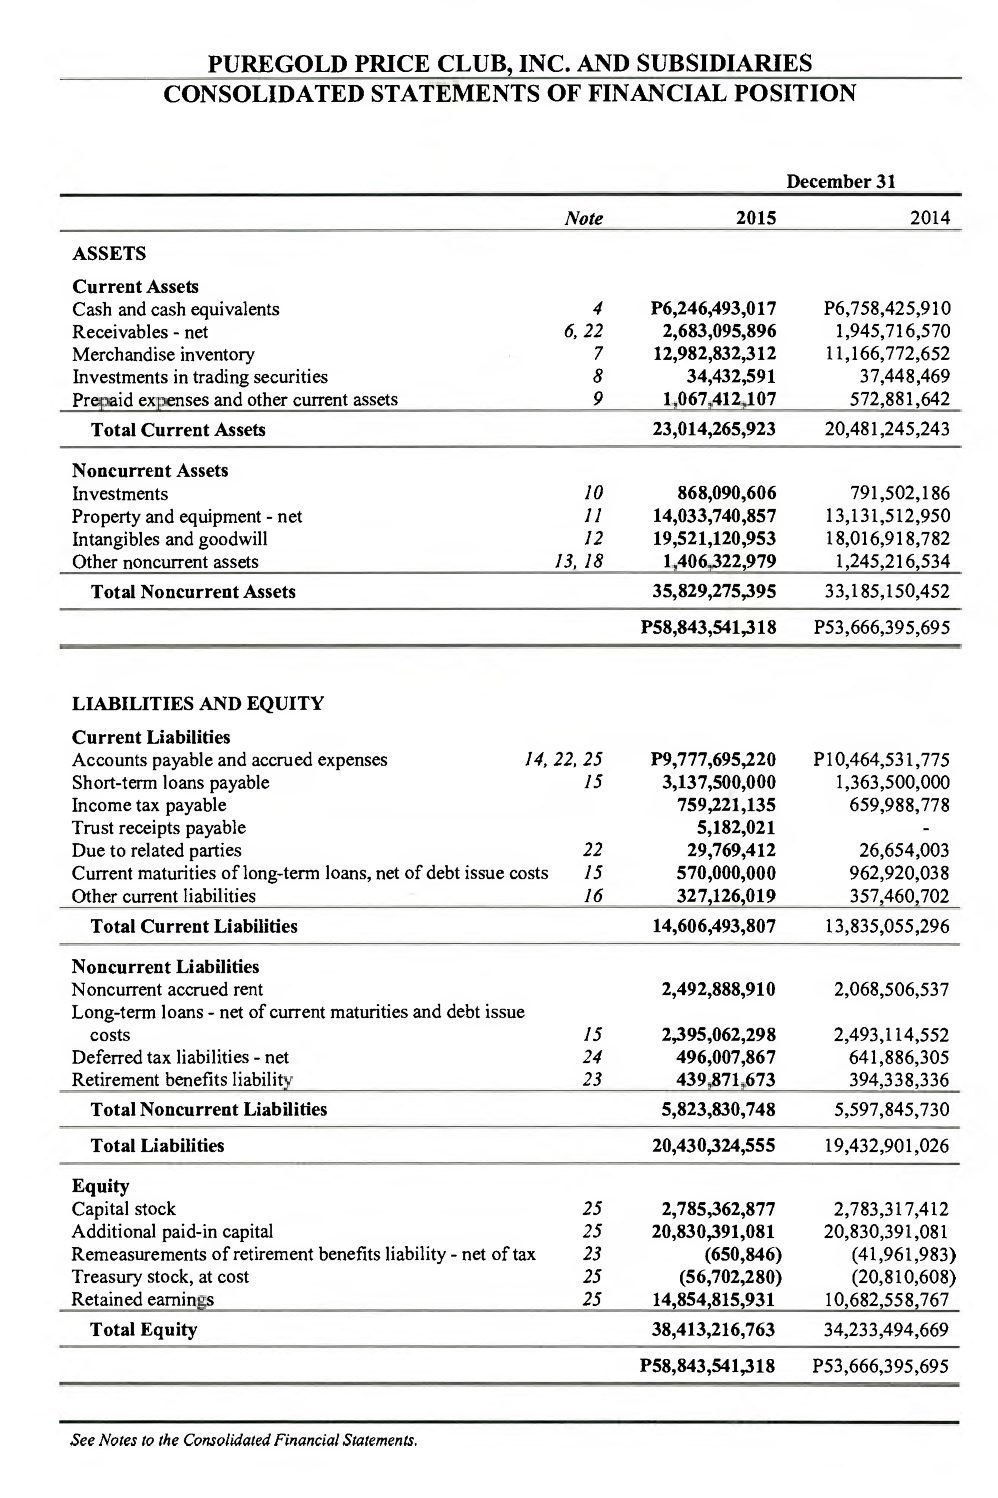
To start, let’s see what a Balance Sheet looks like. Let’s take Puregold (PGOLD) as an example.
We’ll use this example for the rest of the entire post to define the two ratios that I will be discussing today.
So first, let’s start with the Current Ratio
#1 Current Ratio
So first, lets analyze the formula;
Let’s substitute values found in Fig. 1. PGOLD’s Current Assets is at Php 23,014,265,923. Current Liabilities is at Php 14,606,493,807. One thing I want you to focus is that in this example, the Current Assets is greater than the Current Liabilities.
This meant that substituting the values will give us a Current Ratio greater than 1.
A Current Ratio that’s greater than 1 is a good thing because it tells us that the company’s Current Liabilities or short-term obligations can be paid off based on their Current Assets. In the case above, they can pay off all of the liabilities and still be left with Php 8,407,772,116 worth of assets or roughly Php 0.58 per one peso of debt paid.
If the numbers were interchanged in the above example, we would arrive at a Current Ratio of 0.63 which is not good. This would imply that even if we liquidate the Current Assets, there’ll still be Php 8,407,772,116 worth of debt left.
TIP # 1:
The Current Ratio is a very important financial indicator because it can give you an overview of a company’s ability to pay off short-term liabilities.
Benjamin Graham uses this financial ratio in his stock screening criteria in chapter 14 and 15 of The Intelligent Investor book. As a Value Investor, it’s very important that you learn to use this useful ratio.
#2 Debt To Equity Ratio
There are two ways how this ratio is used. The most common formula divides the Total Liabilities by the Shareholder’s Equity.
Some sources take into account only the Total Debts.
Where:
Whatever formula you use is totally fine. The whole point of this ratio is to determine how much debt a company has for every one peso of equity.
If a company has more debt than total equity (D/E > 1), then its not a good thing. A debt that’s equal to total equity (D/E = 1), means that if the company liquidates, the money that will be raised will be just enough to pay off their debt.
Common sense will tell us that if debt is less than the equity (D/E < 1), then it’s a good thing because if the company decided to liquidate or close down the business, it can pay off the debt and there’s still cash that would be left.
It follows that a D/E Ratio of less than one is what we need to look for in a company.
Let’s take PGOLD as an example.
In Fig. 1, Total Liabilities of PGOLD in 2015 is Php 20,430,324,555. Total Shareholder’s Equity is Php 38,413,216,763. Applying the formula, we have;
In this example, we can say that PGOLD has a healthy D/E Ratio since it is less than 1.
If we’ll use Total Debt as the numerator, we need to get the value of it. In Fig. 1, we can see that the Short-Term Debt is at Php 3,137,500,000, Long-Term Debt due is at Php 570,000,000 and Long-Term Debt at around Php 2,395,062,298.
Adding the three figures, we have;
The D/E Ratio is;
Note that this is lower than the other computed value because we only took account of the Total Debt. What I use mostly in my own valuations is the first formula using the Total Liabilities as the numerator.
TIP # 2:
If the D/E Ratio calculated using the Total Liabilities as the numerator is greater than 0.5, I change the numerator by using only the Total Debts and see if it still is greater than 0.5.
In my opinion, a company may be considered worthy of further investigation if it pass this screening test.
In PGOLD’s case, we can see that using the first variation of the formula, PGOLD failed with just a few points (0.03). But if you use the second variation, PGOLD is a pass. If you’ll ask me, I’ll take this as a consideration and investigate further.
Final Thoughts
A company’s financial health is very important in the world of Value Investing. The Current Ratio and Debt To Equity Ratio are two of the most important ratios that can help us determine whether a company is heading for a disaster or not.
If you’re not using these ratios in your valuations, then I suggest you start using them now. I hope that this tutorial has given you a better understanding of these two ratios.
Wanna share your thoughts? Don’t be shy and leave your comments below. Let’s learn from each other.
Happy investing!


EXPLAINED VERY WELL. THANK YOU FOR THIS. GOD BLESS YOU