
Coca-Cola vs PepsiCo is the classic dividend match-up. Both companies sit in the same supermarket aisle. Both are Dividend Kings, with more than 50 years of dividend raises in a row. And both get filed under “safe consumer staples” in almost every portfolio guide.
But in 2026 they’re very different bets. Coca-Cola’s stock is near a record high, while PepsiCo’s is about 30% below its 2023 peak. One yields about 2.3%, the other about 4.4%. One just raised its earnings forecast; the other just cut it.
As an engineer, I like to break a decision like this into measurable parts. So let’s compare KO and PEP on yield, dividend growth, dividend safety, valuation, performance and risk, using dated numbers from company filings. Then we’ll look at who each stock suits, and whether owning both makes sense.
Coca-Cola vs PepsiCo: The Short Answer
PepsiCo pays almost twice the yield (4.42% vs 2.27%) and trades at about 16 times this year’s expected earnings, against about 28.5 times for Coca-Cola. Coca-Cola is the steadier business with better momentum and higher margins. Both dividends are covered on adjusted earnings. PEP suits income-first investors who accept turnaround risk; KO suits investors who want quality and can live with a low starting yield.
Key Takeaways
- PEP pays more. On October 20, 2026, PepsiCo yielded 4.42% on its $1.48 quarterly dividend. Coca-Cola yielded 2.27% on its $0.53 quarterly dividend.
- Both streaks are long. Coca-Cola has raised its dividend for 64 consecutive years and PepsiCo for 54.
- The scary payout ratios are misleading. On 2026 adjusted earnings, KO pays out about 65% and PEP about 71%. The headline figures (165% of KO’s free cash flow, 94% of PEP’s earnings) are distorted by one-off items.
- Dividend growth is slowing at both. PEP’s 2026 raise was 4.0%, down from 10.0% in 2023. KO’s was 3.9%.
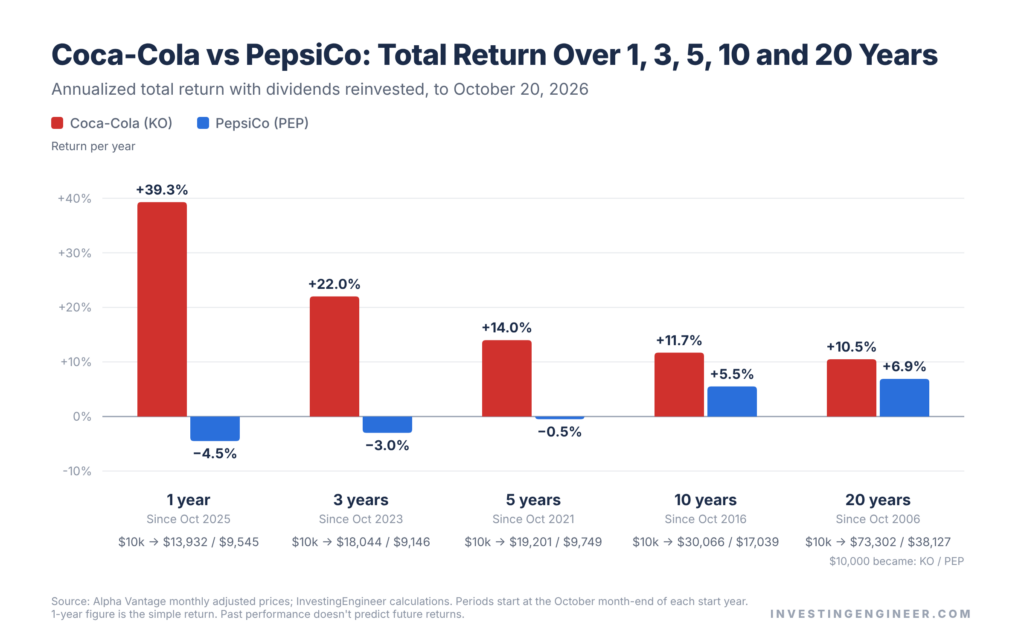
- KO has crushed PEP lately, but not always. Over 20 years, KO returned about 10.5% a year against PEP’s 6.9%. But from late 2016 to the end of 2023, PEP was ahead.
- Valuation now favors PEP. In an illustrative 10-year model, PEP’s base case is about 9.5% a year against about 6.6% for KO. PEP’s range of outcomes is also wider.
Coca-Cola vs PepsiCo at a Glance (October 2026)
| Metric | Coca-Cola (KO) | PepsiCo (PEP) |
|---|---|---|
| Share price | $93.49 | $134.02 |
| Market cap | $402 billion | $183 billion |
| Quarterly dividend | $0.53 | $1.48 |
| Dividend yield (current rate) | 2.27% | 4.42% |
| Consecutive annual raises | 64 years | 54 years |
| Latest dividend raise | +3.9% | +4.0% |
| P/E on 2026 guided adjusted EPS* | ~28.5x | ~16.0x |
| EV/EBITDA | 29.7x | 15.2x |
| Operating margin (FY2025, reported) | 28.7% | 12.2% |
| Return on invested capital (FY2025) | 16.4% | 14.5% |
| Net debt / EBITDA (FY2025) | 2.49x | 2.93x |
| Payout of 2026 adjusted EPS* | ~65% | ~71% |
| Beta vs S&P 500 (2-year) | 0.10 | 0.15 |
*My estimates from company guidance: KO’s 2025 comparable EPS of $3.00 plus 9–10% growth (about $3.29), and PEP’s 2025 core EPS of $8.14 plus 2.5–3.5% growth (about $8.38).
Data: ValueScreener’s KO and PEP reports, built from SEC filings, as of the October 20, 2026 close. Dividend and guidance figures are from company releases. Forward P/E and payout use my estimates from company guidance. (I earn a commission if you subscribe to ValueScreener through this link.)
Two Very Different Businesses
Before comparing numbers, it helps to picture how each company makes money. This explains almost every gap in the table above.
Coca-Cola: A Beverage Brand Company That Lets Bottlers Do the Heavy Lifting
Research The Coca-Cola Company on ValueScreener
I earn a commission if you subscribe to ValueScreener through this link.
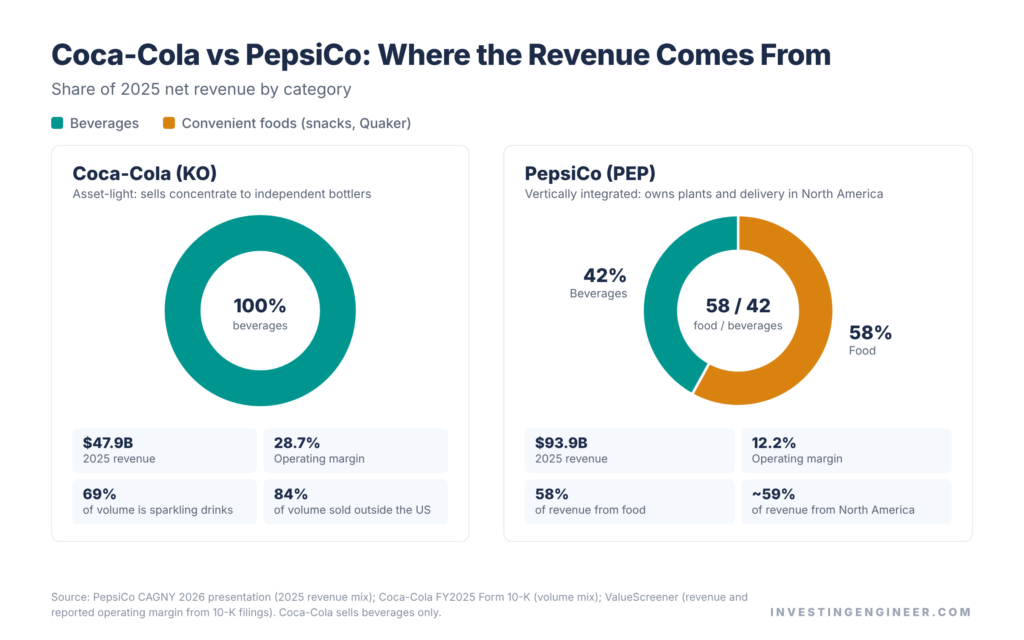
Coca-Cola sells only drinks. Sparkling soft drinks made up 69% of its 2025 unit case volume, and the Coca-Cola trademark alone was 47%. About 84% of its volume is sold outside the US.
The key is the business model. Coca-Cola mostly sells concentrate and syrup to independent bottlers. The bottlers build the factories, buy the trucks, hire the drivers and sell the finished drinks to stores. Think of it this way: Coca-Cola sells the recipe and the brand, and its partners run the kitchen and the delivery vans.
Coca-Cola keeps pushing further in this direction. It has been “refranchising,” or selling company-owned bottlers to partners. In October 2025, Coca-Cola HBC agreed to buy 75% of Coca-Cola Beverages Africa for $2.6 billion, with closing expected by the end of 2026. Selling bottlers shrinks revenue but raises margins.
PepsiCo: A Snacks-and-Beverages Operator That Owns Its Factories and Trucks
Research PepsiCo, Inc. on ValueScreener
I earn a commission if you subscribe to ValueScreener through this link.
PepsiCo is a food company as much as a drinks company. In 2025, convenient foods (Lay’s, Doritos, Cheetos, Tostitos, Quaker) were 58% of revenue and beverages (Pepsi, Mountain Dew, Gatorade, poppi) were 42%. About 59% of revenue comes from North America.
PepsiCo owns much of its own manufacturing and its direct-store-delivery network in North America. So it books the full price of every bag of chips, but it also pays for the plants, warehouses, trucks and drivers. That’s why PepsiCo’s revenue ($93.9 billion in 2025) is nearly double Coca-Cola’s ($47.9 billion), while its market value is less than half.
Why the Margin Gap Doesn’t Make PepsiCo a Bad Business
Coca-Cola’s 2025 operating margin was 28.7% (31.2% on its adjusted “comparable” basis). PepsiCo’s was 12.2%. That looks like a knockout, but it isn’t a fair fight. A company that owns factories and trucks will always have lower margins than one that sells concentrate.
A better yardstick is return on invested capital (ROIC), which measures profit per dollar tied up in the business. In 2025, KO earned 16.4% and PEP 14.5%. From 2020 to 2024, PEP’s ROIC was actually higher than KO’s every year. Both are high-quality businesses; they’re just built differently.
Dividend Showdown: Yield, Growth and Streaks
Current Yield and What $10,000 Pays You
At October 20, 2026 prices, $10,000 buys about 74.6 PepsiCo shares, which pay about $442 a year at the current $5.92 annual rate. The same $10,000 buys about 107 Coca-Cola shares, which pay about $227 a year at $2.12 a share. That’s before any taxes.
PEP’s yield is near the top of its 10-year range. GuruFocus puts its 10-year median at 2.85% and its high at 4.61%. KO’s yield is at the bottom of its range, against a 10-year median of 3.03%. In plain terms, KO is priced near its most optimistic level in a decade and PEP near its most pessimistic.
Dividend Growth: PEP Grew Faster, but Both Are Slowing
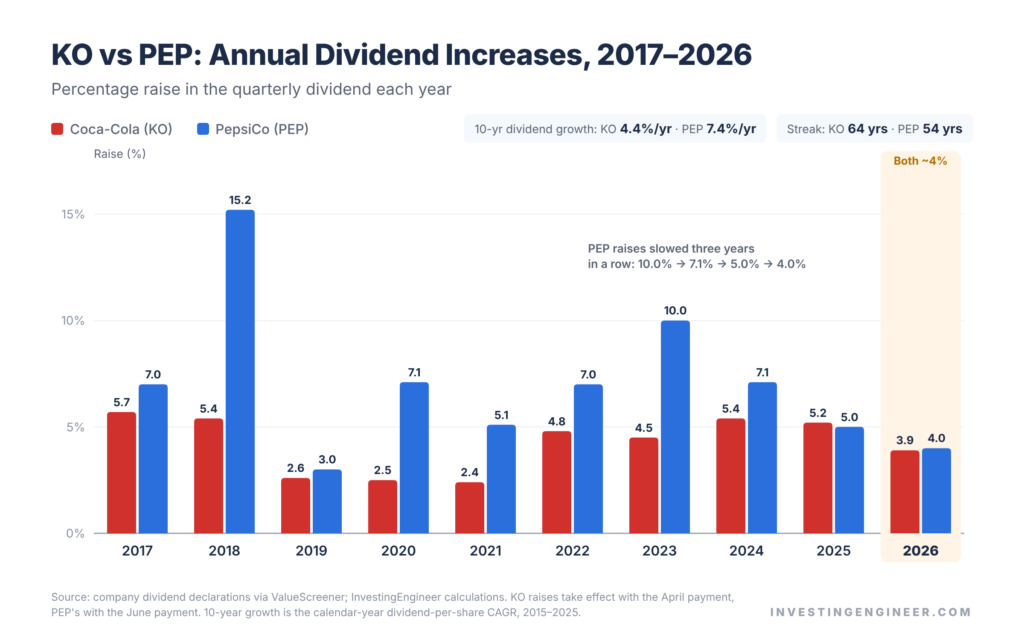
Over the past decade, PepsiCo grew its dividend much faster: about 7.4% a year from 2015 to 2025, against 4.4% for Coca-Cola. But look at the most recent raises:
| Year | KO dividend raise | PEP dividend raise |
|---|---|---|
| 2021 | 2.4% | 5.1% |
| 2022 | 4.8% | 7.0% |
| 2023 | 4.5% | 10.0% |
| 2024 | 5.4% | 7.1% |
| 2025 | 5.2% | 5.0% |
| 2026 | 3.9% | 4.0% |
Raise in the quarterly dividend rate. Source: company dividend declarations via ValueScreener.
PepsiCo’s raises have slowed for three years running, and in 2026 the two companies grew their dividends at almost exactly the same pace. Coca-Cola’s raises have stayed in a narrow 4–5% band for years. So don’t assume PEP’s historical dividend growth edge will continue.
Is Each Dividend Safe? Two Red Flags Explained
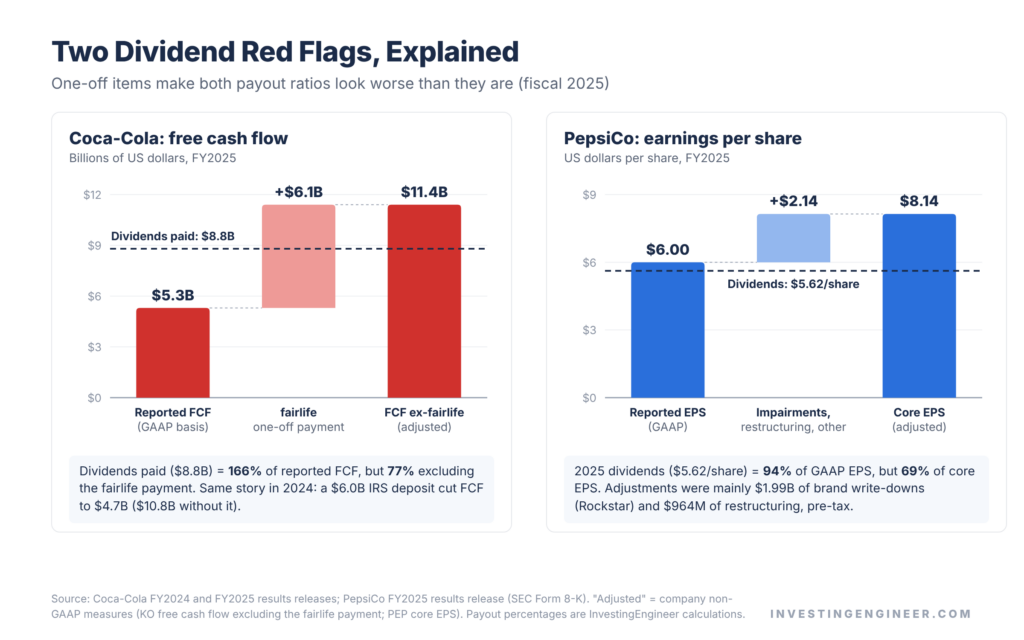
If you screen these two stocks, you’ll probably see two alarming numbers. Coca-Cola appears to pay out about 165% of its free cash flow, and PepsiCo about 94% of its earnings. Both numbers are technically correct and both are misleading.
Coca-Cola’s Free Cash Flow “Collapse”
Free cash flow (FCF) is the cash left after a company pays to run and maintain its business. Coca-Cola’s reported FCF fell from $9.7 billion in 2023 to $4.7 billion in 2024 and $5.3 billion in 2025, while it paid $8.8 billion in dividends in 2025.
Two one-time payments explain the drop:
- 2024: a $6.0 billion deposit to the US Internal Revenue Service (IRS) tied to a long-running tax dispute. Excluding it, FCF was $10.8 billion.
- 2025: a $6.1 billion final payment for the 2020 purchase of fairlife, the milk brand. Excluding it, FCF was $11.4 billion.
For 2026, Coca-Cola guides to about $12.4 billion of FCF. Against roughly $9.1 billion of dividends, that’s a payout of about 74%. So the dividend is comfortably covered.
PepsiCo’s 94% Payout Ratio
PepsiCo’s 2025 reported (GAAP) earnings per share fell 14% to $6.00. Against $5.62 of dividends, that’s a 94% payout. But 2025 earnings absorbed $1.99 billion of non-cash write-downs on brand values, mostly Rockstar energy drinks, plus $964 million of restructuring charges.
On PepsiCo’s adjusted “core” EPS of $8.14, the 2025 payout was about 69%. On my estimate of 2026 core EPS (about $8.38), the $5.92 annual dividend is about 71% of earnings. PepsiCo’s trailing 12-month FCF reached $9.2 billion by mid-2026, which covers its planned $7.9 billion of 2026 dividends about 1.16 times.
Payout Ratios, Reconciled
| Coverage measure | Coca-Cola (KO) | PepsiCo (PEP) |
|---|---|---|
| 2025 dividend ÷ reported EPS | 67% | 94% |
| 2025 dividend ÷ adjusted EPS | 68% | 69% |
| 2026 dividend ÷ 2026E adjusted EPS | ~65% | ~71% |
| Dividends ÷ reported FCF (2025) | ~166% | ~100% |
| Dividends ÷ normalized FCF | ~74% (2026 guidance) | ~86% (trailing 12 months) |
The verdict on safety: Neither dividend looks at risk of a cut on current numbers. PepsiCo’s cushion is thinner, especially on cash flow, so the realistic risk at PEP is slower dividend growth, not a cut.
Want to catch one-off swings like these yourself? ValueScreener lays out 10 years of free cash flow, margins and earnings from each company’s filings, side by side. A $6 billion drop in a single year jumps out, and you can trace it back to the filing to see whether it’s a one-time payment or a real problem. (I earn a commission if you subscribe to ValueScreener through this link.)
What’s Going On at PepsiCo?
PepsiCo’s problem is concentrated in one place: North American snacks, the unit that sells Lay’s, Doritos and Tostitos (PFNA). In the third quarter of 2026, reported October 8, PFNA’s core operating profit fell 12% in constant currency. PepsiCo then cut its 2026 forecast for core constant-currency EPS growth to just 1–2%, from the low end of 4–6%.
The rest of the company is doing much better. North American beverages grew core operating profit 4% in constant currency, Europe/Middle East/Africa 19%, Latin America 10% and Asia Pacific 12%. Total organic revenue rose 3.1%.
Activist investor Elliott Investment Management took a roughly $4 billion stake in September 2025 and pushed for change. In December 2025, PepsiCo agreed to cut nearly 20% of its US products, lower prices on its value tiers, refresh its board and review its North American supply chain. It also closed three US plants in 2025. After the Q3 report, CEO Ramon Laguarta said additional structural cost cuts “will be implemented in the coming months.”
The key question for a 10-year holder: is the snack slump cyclical (stretched shoppers trading down) or structural (GLP-1 drugs, healthier eating, store brands)? We’ll come back to that in the headwinds section.
Is Coca-Cola Stock Too Expensive Now?
Coca-Cola has had an outstanding 2026. Unit case volume grew 5% in the second quarter, and in July management raised its forecast to 9–10% growth in comparable EPS. The stock jumped more than 6% toward a record high that day and has returned about 36% this year.
The catch is the price. At $93.49, KO trades at about 28.5 times my estimate of 2026 earnings and yields just 2.27%. To check what that price assumes, I ran a simple reverse calculation. At an 8% required return, KO’s price implies its free cash flow grows about 4.8% a year forever. For PepsiCo, the same math implies only about 2.8%.
Neither assumption is crazy. But KO’s price leaves less room for disappointment, and it reports third-quarter results on October 27, 2026. One loose end: Coca-Cola’s appeal in its IRS tax case was argued in June 2026, and a full loss could add up to roughly $20 billion of total exposure including later years, according to coverage of the case. KO has already deposited $6.0 billion.
Coca-Cola vs PepsiCo Stock Performance
Total Returns Over 1, 3, 5, 10 and 20 Years
| Period (to Oct 20, 2026) | KO total return | PEP total return | $10,000 became (KO / PEP) |
|---|---|---|---|
| 1 year | +39.3% | −4.5% | $13,932 / $9,545 |
| 3 years | +80.4% (22.0%/yr) | −8.5% (−3.0%/yr) | $18,044 / $9,146 |
| 5 years | +92.0% (14.0%/yr) | −2.5% (−0.5%/yr) | $19,201 / $9,749 |
| 10 years | +200.7% (11.7%/yr) | +70.4% (5.5%/yr) | $30,066 / $17,039 |
| 20 years | +633.0% (10.5%/yr) | +281.3% (6.9%/yr) | $73,302 / $38,127 |
Dividends reinvested. My calculation from Alpha Vantage monthly adjusted closing prices, starting at the end of October in each start year.
Why the Start Date Changes the Winner
That table makes KO look like the obvious long-term winner. But change the end date and the story flips. From October 2016 to December 2023, PepsiCo returned about 95% and Coca-Cola about 75%. PEP also beat KO in 9 of the 20 calendar years from 2006 to 2025, including every year from 2013 to 2017 and from 2019 to 2021.
Test Coca-Cola vs PepsiCo From Your Own Start Date
Start in late 2016 and stop at the end of 2023, and PepsiCo is ahead. Stretch the end date to October 2026, and Coca-Cola wins by a mile. Plot KO and PEP on one chart, switch to percentage view and move the dates around. You’ll see how much the “winner” depends on when you begin. It’s also an easy way to watch how KO reacts to its Q3 report on October 27.
Compare KO vs PEP on TradingView →Affiliate link. We may earn a commission at no extra cost to you.
How They Held Up in Crashes
| Episode (monthly closes) | KO decline | PEP decline |
|---|---|---|
| 2007–09 financial crisis | −32% | −36% |
| 2020 COVID crash | −24% | −15% |
| 2022 rate shock | −12% | −6% |
| 2023–2026 | −13% (2024) | −27% (Apr 2023 to May 2025) |
In 2022, as the 10-year US Treasury yield climbed from 1.8% to about 4%, both stocks still delivered positive total returns (KO +10.6%, PEP +6.8%). Neither is crash-proof, and their worst stretches haven’t always lined up. Their annual returns have been about 0.71 correlated since 2006: related, but far from identical.
Headwinds: GLP-1 Drugs, SNAP Restrictions and Health Rules
GLP-1 weight-loss drugs. A Cornell study using purchase data from about 150,000 US households, published in the Journal of Marketing Research in December 2025, found that households with a GLP-1 user cut grocery spending by about 5.3% within six months. Savory snacks fell about 10%, with sweets and baked goods hit similarly. The share of US households with a user has kept rising; Circana puts it at about 23%. Since 58% of PepsiCo’s revenue is food, this matters more for PEP than for beverage-only Coca-Cola.
SNAP restrictions. The US Department of Agriculture has approved waivers letting 23 states bar soda and/or candy from SNAP (food stamp) purchases, most starting in 2026, though a federal judge blocked five states’ waivers in June 2026. Soda is the most common target, so this touches both companies’ US drink sales. PepsiCo’s CEO has called the expected impact “very limited.”
Ingredient rules. After US regulators moved against synthetic food dyes in 2025, PepsiCo began switching its US snacks to natural colors. That’s a cost and reformulation challenge more than a demand threat.
The takeaway: these headwinds lean harder on snacks than on drinks, which is one reason the market now prices PEP so differently from KO.
What Could Each Stock Return Over the Next 10 Years?
A simple way to estimate a stock’s long-term return is: starting yield + dividend growth ± change in valuation. For example, if KO yields 2.3%, grows 6% a year and its P/E slips from 28.5x to 24x over 10 years (about −1.7% a year), you get roughly 6.6% a year.
Here are three illustrative scenarios for each stock. These are my assumptions, not forecasts.
| Scenario | KO assumptions | KO return/yr | PEP assumptions | PEP return/yr |
|---|---|---|---|---|
| Bear | 3.5% growth; P/E 28.5x → 20x | ~2.3% | 2.0% growth; P/E 16x → 13x | ~4.4% |
| Base | 6.0% growth; P/E 28.5x → 24x | ~6.6% | 4.5% growth; P/E 16x → 17x | ~9.5% |
| Bull | 7.5% growth; P/E unchanged | ~9.8% | 6.5% growth; P/E 16x → 20x | ~13.2% |
In the base case, $10,000 grows to about $18,900 in KO and about $24,900 in PEP after 10 years. PEP’s yield on your original cost would reach about 6.9%, against about 4.1% for KO.
PEP wins the base case because it starts with nearly twice the yield and a much lower valuation. But look at the bear case: if snacks keep shrinking, PEP’s low P/E can stay low, and the “cheap” stock becomes a value trap. KO’s risk is different. A great business can still deliver a mediocre return if you pay too much for it. For more on that idea, see our Top 10 Undervalued Stocks to Buy.
Bull and Bear Cases
Coca-Cola bull case
- Volume growth is back, and 2026 comparable EPS is guided up 9–10%.
- Refranchising should keep lifting margins and returns on capital.
- Beverage-only exposure means less GLP-1 risk than a snack-heavy company.
- Free cash flow is returning to about $12.4 billion, covering the dividend about 1.35 times.
Coca-Cola bear case
- At about 28.5 times earnings and a 2.27% yield, much of the good news is already priced in.
- The pending IRS appeal is a multi-billion-dollar risk.
- Dividend growth has averaged only about 4.4% a year over 10 years.
- A new CEO (Henrique Braun, since March 31, 2026) has yet to prove himself in a downturn.
PepsiCo bull case
- A 4.42% yield near a 10-year high, at about 16 times earnings.
- International businesses are growing operating profit at double digits.
- The Elliott-driven reset (fewer products, lower prices, plant closures, new cost cuts) could restore snack profits.
- PEP has outperformed KO for long stretches before, including most of 2013–2021.
PepsiCo bear case
- North American snack profits are falling, and the cause may be structural.
- 2026 core EPS growth of 1–2% is far below the company’s high-single-digit target.
- Dividend growth has slowed to 4.0%, and debt has risen (net debt/EBITDA 2.93x).
- Cheap stocks with shrinking earnings can stay cheap for years.
The Dividend Scorecard
| Category | Coca-Cola | PepsiCo | Edge |
|---|---|---|---|
| Current yield | 2.27% | 4.42% | PEP |
| 10-year dividend growth | 4.4%/yr | 7.4%/yr | PEP |
| Recent dividend growth (2026) | 3.9% | 4.0% | Tie |
| Dividend streak | 64 years | 54 years | KO |
| Dividend safety (adjusted payout) | ~65% | ~71% | KO |
| Valuation (forward P/E) | ~28.5x | ~16.0x | PEP |
| Business quality (margins, ROIC) | 31.2% comparable margin; 16.4% ROIC | 12.2% margin; 14.5% ROIC | KO |
| Balance sheet (net debt/EBITDA) | 2.49x | 2.93x | KO |
| Momentum (2026 guidance) | +9–10% EPS | +1–2% core cc EPS | KO |
| Exposure to GLP-1 and snack risk | Lower | Higher | KO |
On a pure count, KO wins more rows. But the rows PEP wins, yield and valuation, are the ones that drive long-term returns from today’s starting point. That’s why this comparison is genuinely close.
Which Dividend King Fits Your Portfolio?
Choose Coca-Cola If…
- You want the steadier, higher-margin business and are comfortable with a 2.3% starting yield.
- You’re decades from needing the income and care more about predictability than about current cash.
- You’d rather pay up for momentum than bet on a turnaround.
Choose PepsiCo If…
- You want more income today: a 4.4% yield on a 54-year dividend streak.
- You’re comfortable owning a business that has to prove its snack profits can recover.
- You believe today’s low valuation already prices in a lot of bad news.
Should You Own Both?
For many dividend investors, yes, owning both is a reasonable middle path. Their annual returns are about 0.71 correlated, so they don’t move in lockstep. Pairing them blends KO’s quality with PEP’s yield, and snack exposure with beverage-only exposure. A 50/50 split today would yield about 3.3%.
Before buying either, check what you already own. Many broad US dividend and quality ETFs hold both stocks. If you own a fund like SCHD or VYM, you may already have exposure. See our comparison of [internal link: SCHD vs VYM].
A Note on Taxes and Account Type for International Investors
If you live outside the US, US dividends are usually subject to withholding tax: 30% by default, often reduced to 15% under a tax treaty if you file a W-8BEN form with your broker. The account type matters too. Some retirement accounts (for example, Canada’s RRSP) are exempt from US withholding under their treaty, while others (such as a UK ISA or Canada’s TFSA) are not. Withholding hits PEP’s larger dividend harder in dollar terms, so check the rules for your country and account before comparing after-tax yields.
What to Watch Next
- October 27, 2026: Coca-Cola’s Q3 results, before the US market opens. Watch whether volume growth holds and whether the 9–10% EPS guidance is maintained.
- Early 2027: PepsiCo’s Q4 results and 2027 outlook. The key signals are PFNA profit trends, the size of the new cost cuts and the 2027 dividend raise.
- IRS ruling: the Eleventh Circuit’s decision in Coca-Cola’s tax appeal.
- Coca-Cola Beverages Africa sale: expected to close by year-end, lowering KO’s revenue but raising margins.
- SNAP and GLP-1 data: any evidence that snack volumes are stabilizing or still falling.
How to Compare Dividend Stocks Yourself
The two “red flags” in this article only made sense once I looked at 10 years of filed numbers: free cash flow by year, margins by year and the full dividend record. That’s the kind of check worth doing before you buy any dividend stock.
Check any dividend stock’s numbers in minutes, not hours
Most of the figures in this article came from ValueScreener, which traces every number back to the SEC filing it came from. Open the full Coca-Cola and PepsiCo reports, read each company’s complete dividend record, and compare 10 years of margins and free cash flow side by side. That’s how the “165% payout” and “94% payout” red flags turned out to be one-off items.
See the KO and PEP reports → I earn a commission if you subscribe to ValueScreener through this link.
Frequently Asked Questions
Which is a better stock, Coca-Cola or PepsiCo?
It depends on your goal. As of October 20, 2026, PepsiCo offers a higher yield (4.42% vs 2.27%) and a lower valuation (about 16x vs 28.5x 2026 earnings). Coca-Cola offers higher margins, stronger recent growth and a longer dividend streak. Income-first investors often lean PEP; quality-first investors lean KO.
Is PepsiCo’s dividend safe?
On current numbers, yes. PepsiCo’s $5.92 annual dividend is about 71% of estimated 2026 core earnings and about 86% of its trailing 12-month free cash flow. The 94% payout often quoted uses 2025 GAAP earnings reduced by $1.99 billion of write-downs. The bigger risk is slower dividend growth, not a cut.
How many years has Coca-Cola raised its dividend?
Coca-Cola has raised its dividend for 64 consecutive years as of 2026. Its latest increase, in February 2026, lifted the quarterly dividend 3.9% to $0.53 a share.
Is PepsiCo a Dividend King?
Yes. A Dividend King is a company that has raised its dividend for at least 50 consecutive years. PepsiCo’s 2026 increase was its 54th in a row, lifting the annualized dividend 4% to $5.92 a share.
Why is PepsiCo stock down in 2026?
Profits in PepsiCo’s North American snack business are falling. In Q3 2026, that unit’s core operating profit dropped 12% in constant currency, and PepsiCo cut its 2026 core constant-currency EPS growth forecast to 1–2%. Concerns about GLP-1 drugs and value-seeking shoppers have added pressure.
Is Coca-Cola stock overvalued?
By its own history, it’s expensive. At about 28.5 times estimated 2026 earnings, KO’s 2.27% yield is near its lowest in 10 years. Its price implies roughly 4.8% perpetual free cash flow growth at an 8% required return, which is achievable but leaves little margin for error.
Should I buy both KO and PEP?
Owning both is a reasonable choice for many dividend investors. Their annual returns have been about 0.71 correlated since 2006, and they combine beverage-only quality with a higher-yielding food and drinks business. Check your ETFs first, since many dividend funds already hold both.
When does Coca-Cola report earnings next?
Coca-Cola reports third-quarter 2026 results on October 27, 2026, before the New York Stock Exchange opens, with a conference call at 8:30 a.m. ET.
Conclusion
Coca-Cola vs PepsiCo isn’t a contest between a good company and a bad one. It’s a choice between paying a full price for a business that’s executing well and buying a higher yield in a business that has to fix its biggest division.
The data says both dividends are covered on adjusted earnings, both are growing at about 4% right now, and the famous payout-ratio red flags are mostly one-off accounting noise. KO has won decisively since 2024, but PEP led for most of the decade before that. From today’s prices, my illustrative base case favors PEP, while the bear cases show why KO’s steadiness still has value.
If you want income now and can tolerate a turnaround, PepsiCo fits. If you want quality and can accept a low starting yield, Coca-Cola fits. If you can’t decide, owning both is a sensible engineer’s compromise. Either way, this is analysis, not investment advice.
Next Steps
Check the filed numbers
Open the KO and PEP reports: dividend history, payout, free cash flow and margins, each traced to its SEC filing.
Open ValueScreener →I earn a commission if you subscribe to ValueScreener through this link.
Chart it and set alerts
Plot KO vs PEP total return and set a price or yield alert ahead of KO’s Q3 report on October 27.
Open TradingView →Affiliate link. We may earn a commission at no extra cost to you.
- Watch Coca-Cola’s Q3 report on October 27, 2026, and PepsiCo’s 2027 outlook in early 2027.
- Check whether your dividend ETFs already hold both stocks.
- Read more dividend comparisons: Realty Income vs VICI and BP vs Shell dividend comparison.
Sources
- PepsiCo Q3 2026 earnings release (SEC Form 8-K, Oct 8, 2026)
- PepsiCo Q4 and full-year 2025 results (SEC Form 8-K, Feb 3, 2026)
- Coca-Cola Q2 2026 earnings release (SEC Form 8-K, Jul 28, 2026)
- Coca-Cola Q4 and full-year 2025 results (Feb 10, 2026)
- Coca-Cola Q4 and full-year 2024 results (Feb 11, 2025)
- Coca-Cola Q3 2026 earnings date announcement
- PepsiCo quarterly dividend declaration (May 6, 2026)
- PepsiCo CAGNY 2026 presentation
- Supermarket News: PepsiCo to eliminate nearly 20% of products (Dec 2025)
- Baking Business: Cornell study on GLP-1s and food spending
Trading, not investing? If you want to trade short-term moves in KO or PEP around earnings rather than hold them for dividends, Pepperstone offers US share CFDs. CFDs are leveraged and do not give you ownership of the shares or the right to their dividends in the usual way.
Learn more about Pepperstone →Affiliate link. CFDs are complex instruments and come with a high risk of losing money rapidly due to leverage. Most retail investor accounts lose money when trading CFDs. Consider whether you understand how CFDs work and whether you can afford to take the high risk of losing your money.
Disclosure: The content on this page was produced with AI writing assistance under the editorial direction of a licensed Electrical Engineering practitioner and certified investor in different markets with over a decade of experience. All articles are reviewed and approved by the author before publication.
