
Bitcoin and Ethereum are heading into the week of July 13–17, 2026 on a fragile two-week winning streak. Bitcoin closed last week at $63,019, and Ethereum finished at $1,795, right up against a resistance level it hasn’t been able to break since June. Normally that would be the headline. This week, it isn’t. Instead, the market’s attention is fixed on two events landing within 90 minutes of each other on Tuesday: the release of June’s inflation data, and the first-ever congressional testimony from Federal Reserve Chair Kevin Warsh — a man who has publicly disclosed that he personally owns Bitcoin. That combination makes this one of the more unusual weeks crypto markets have faced in months, and it’s why this outlook leads with the macro calendar rather than a coin-by-coin rundown.
Quick Answer: What You Need to Know This Week
Bitcoin’s two-week rebound to the low-$60,000s is real but unconfirmed. It’s being supported by a second straight week of positive ETF flows and heavy buying from large “whale” wallets, but overall market sentiment remains stuck in “Extreme Fear” and Strategy Inc. (formerly MicroStrategy) just sold Bitcoin for the first time this cycle. This week’s June inflation report and Fed Chair Kevin Warsh’s first congressional testimony — both landing Tuesday, July 14 — are the events most likely to decide whether that rebound continues toward $65,000–$68,000 or slips back toward $60,000. A separate, unresolved conflict between the US and Iran, and an oil-sanctions waiver expiring July 17, add a second layer of risk that traders don’t usually have to think about when reading crypto charts.
Why This Is Crypto’s Biggest Macro Week in Months
Most weeks, crypto news is dominated by crypto-specific events — a token unlock, an exchange hack, an ETF filing. This week is different. Five separate macroeconomic releases land inside five trading days: June’s Consumer Price Index (CPI) on Tuesday, back-to-back congressional testimony from the Fed chair on Tuesday and Wednesday, June producer prices (PPI) and the Fed’s Beige Book on Thursday, and consumer sentiment data on Friday. Layered on top of that is an active military conflict between the United States and Iran that has already pushed oil prices sharply higher.
What is CPI, and why does it move crypto prices?
The Consumer Price Index is a monthly government report that measures how much prices for everyday goods and services have changed compared to a year earlier. It’s the single most-watched inflation gauge in the world because the Federal Reserve uses it, alongside other data, to decide whether to raise, lower, or hold interest rates. Higher interest rates tend to pull money out of riskier assets — including Bitcoin and Ethereum — because investors can earn a safer return elsewhere. Forecasters expect June’s headline CPI to actually fall to about 3.8% year-over-year from May’s 4.2%, largely because gasoline prices dropped. But the number the Fed watches more closely, core CPI (which strips out food and energy), is expected to hold near 2.9% — a sign that underlying inflation pressure hasn’t really eased. That split matters: a soft headline number could tempt some investors into thinking the inflation fight is over, while a sticky core number gives Warsh every reason to sound cautious.
Why does a Fed chair’s congressional testimony matter for Bitcoin specifically?
Twice a year, the Fed chair is required to appear before Congress and explain the central bank’s policy decisions in a hearing known as the Semiannual Monetary Policy Report. Markets watch these appearances closely for any hint about future rate moves. This particular testimony carries an unusual extra dimension: Kevin Warsh, in his first appearance in the role, has disclosed that he personally holds Bitcoin. Lawmakers are expected to press him not just on interest rates, but on bitcoin regulation and his approach to bank oversight of digital assets — topics a Fed chair rarely fields directly. That makes this testimony a genuine, crypto-specific event, not just a generic macro data point that happens to affect everything.
Warsh testifies before the House Financial Services Committee on Tuesday, July 14, roughly 90 minutes after the CPI release, and before the Senate Banking Committee on Wednesday, July 15. June PPI, the Fed’s Beige Book, and weekly jobless claims follow on Thursday, and the University of Michigan’s consumer sentiment survey closes out the week on Friday — the same day a US Treasury waiver on Iranian oil sales is set to expire, adding a fresh, unscheduled wildcard to an already dense week.
EXPLAINER

How Does Fed Chair Testimony Historically Affect Bitcoin?

Fed chair testimony isn't usually a crypto-specific event — it mostly moves Bitcoin the same way it moves stocks, through interest-rate expectations. A hawkish tone (signaling higher rates for longer) tends to strengthen the dollar and pressure risk assets, Bitcoin included, since higher rates make safer, yield-bearing investments more attractive relative to a non-yielding asset like Bitcoin. A dovish tone tends to do the opposite. Historically, the market reaction has been sharpest when testimony surprises relative to what was already priced in — a chair who simply confirms expectations tends to produce a muted move, while an unexpected shift in tone can trigger outsized swings within minutes of the remarks.This week adds a genuinely new variable: Kevin Warsh has disclosed personal Bitcoin holdings, so his testimony carries a direct crypto angle that past Fed testimony hasn't had. There's no historical precedent for how markets react when a sitting Fed chair is questioned about an asset he personally owns, which is exactly why analysts are flagging this as unusually high event risk rather than a routine hearing.
Bitcoin Deep Dive: Testing $64,000 Into a Wall of Macro Risk
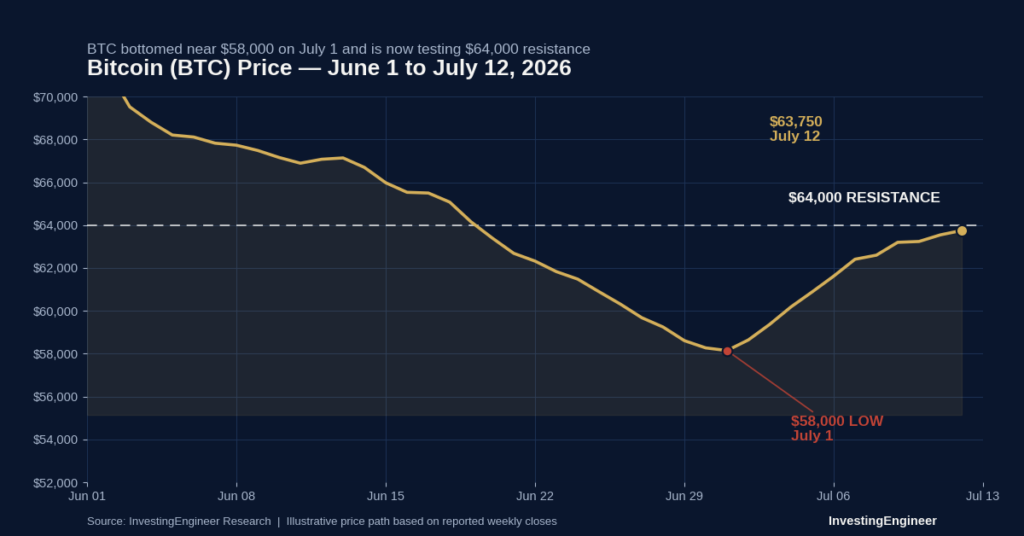
Bitcoin closed the prior week at $63,019, its second consecutive weekly gain after bottoming near $58,000 on July 1, and was last trading near $63,700–$63,800 heading into this window. The bounce has been driven almost entirely by improving ETF flows and a softer-than-feared June jobs report — not by any resolution of the deeper macro picture. Notably, Bitcoin has so far shrugged off the US–Iran conflict that has rattled oil and currency markets, a sign of relative resilience, though a genuine risk-off shock remains its biggest identifiable tail risk this week.
US spot Bitcoin ETFs are working through a second straight week of net inflows, led by BlackRock’s IBIT fund, after June delivered a record $4.0–4.5 billion in net outflows — the worst month for these funds since they launched. Daily flows are still choppy: a single day brought in $253.7 million, while other days in the same stretch saw $85–95 million head out the door. But taken as a whole, the week ending July 10 was the first confirmed positive week for both Bitcoin and Ethereum funds together. Year-to-date, Bitcoin ETFs are still net negative by roughly $5.4 billion, a reminder that this recovery has real ground to make up.
On-chain data — information recorded directly on the Bitcoin blockchain, which anyone can verify — tells an even more bullish story on the surface. Large-holder “whale” wallets added more than 270,000 BTC, worth roughly $16.7 billion, in the two weeks into early July, with the bulk of that buying concentrated near $58,000–$59,000. That kind of concentrated buying tends to create real technical support, because holders who bought there are reluctant to sell at a loss. Bitcoin held on exchanges also sits at a seven-year low, meaning less of the available supply is sitting on trading platforms ready to be sold.
Strategy Inc. (the company formerly known as MicroStrategy, still the largest corporate holder of Bitcoin) held 843,775 BTC as of early July at an average cost of $66,384.56 per coin — modestly above the current spot price. In a notable shift, the company sold about 3,588 BTC in early July to fund dividend payments, its first disclosed sale of this cycle. It’s a small transaction relative to its overall holdings, but it’s worth flagging because Strategy’s reputation as a buyer who never sells has been a pillar of the bullish corporate-adoption story.
Bitcoin Key Levels
| Level Type | Price | What It Means |
|---|---|---|
| Resistance | $68,000 | Next major hurdle if the rally extends |
| Resistance | $65,000 | Intermediate target on continued ETF inflows |
| Resistance | $64,000 | A weekly close above this level would open the path higher |
| Support | $62,000 | Losing this level reopens a retest of $60,000 |
| Support | $60,000 | Psychological level and short-term floor |
| Support | $57,700 | Recent cycle low; hardest floor identified this week |
Friday, July 17, also brings Bitcoin’s monthly options expiry on the Deribit exchange — typically a much larger event than the weekly expiries. One notable options position tracked by analysts is a structure called a long call condor, built around the $64,000, $66,000, $68,000, and $70,000 strike prices. Without getting too deep into the mechanics, that kind of positioning suggests some professional traders are betting Bitcoin lands somewhere between $66,000 and $68,000 by expiry — not a runaway breakout, but not a collapse either.
EXPLAINER

What Is a Call Condor Options Strategy?

An options contract gives a trader the right (but not the obligation) to buy or sell an asset at a set price by a certain date. A “call” option specifically bets that the price will rise. A call condor combines four call options at four different price levels (strikes) to build a trade that profits most if the asset lands inside a specific range by expiry, rather than making an unlimited bet on a big move in either direction.In this week's setup, traders are long calls at $64,000 and $70,000 while short calls at $66,000 and $68,000. In plain terms: the trade pays off best if Bitcoin settles between $66,000 and $68,000 on July 17, loses less than an outright bullish bet if Bitcoin falls short of $64,000, and caps its upside if Bitcoin rallies well past $70,000. Because this kind of structure is capped on both ends, it tells you the trader placing it expects a contained, range-bound move rather than a breakout — useful context for interpreting where professional positioning thinks Bitcoin is headed this week, without needing to trade options yourself.
Track Bitcoin’s $62K–$68K Range Through CPI and the Fed
BTC is testing $64K resistance just as June CPI and Fed Chair Warsh’s testimony land — follow every move with free charts, watchlists, and price alerts.
Open Free Charts on TradingView →Ethereum Deep Dive: The $1,804 Level That Keeps Rejecting Every Bounce
Ethereum closed the prior week at $1,795, up about 3%, right at the edge of the $1,800–$1,804 zone that has capped every recovery attempt since June’s selloff. A confirmed close above $1,804 would be Ethereum’s first such break since that selloff began, and it would open a path toward $1,900–$2,000. A failure here, followed by a drop below $1,650, would reopen the $1,547–$1,500 zone.
The Ethereum Foundation’s ongoing restructuring — a 20% staff cut and a 40% budget reduction — has weighed modestly on sentiment, but Ethereum co-founder Vitalik Buterin’s newly outlined “Lean Ethereum” roadmap has given the community a longer-term positive story to focus on around simplifying the protocol. On the ETF side, Ethereum funds just posted their first positive week in eight weeks, adding $84.4 million in net inflows for the week ending July 10 — Ethereum’s clearest sign of improving institutional demand in two months, even though the fund category remains more volatile day-to-day than its Bitcoin counterpart.
Ethereum also remains the backbone of two of crypto’s biggest structural stories: tokenized real-world assets (about 65% of that market’s tracked value sits on Ethereum) and stablecoin issuance, a space that just got a lot more competitive (more on that below). Layer-2 networks — faster, cheaper blockchains built on top of Ethereum — continue to absorb most retail transaction activity, keeping fees low on the main network, a steady positive that doesn’t move weekly prices but supports Ethereum’s longer-term case.
The Fear & Greed Puzzle: Whales Are Buying, but Sentiment Says “Extreme Fear”
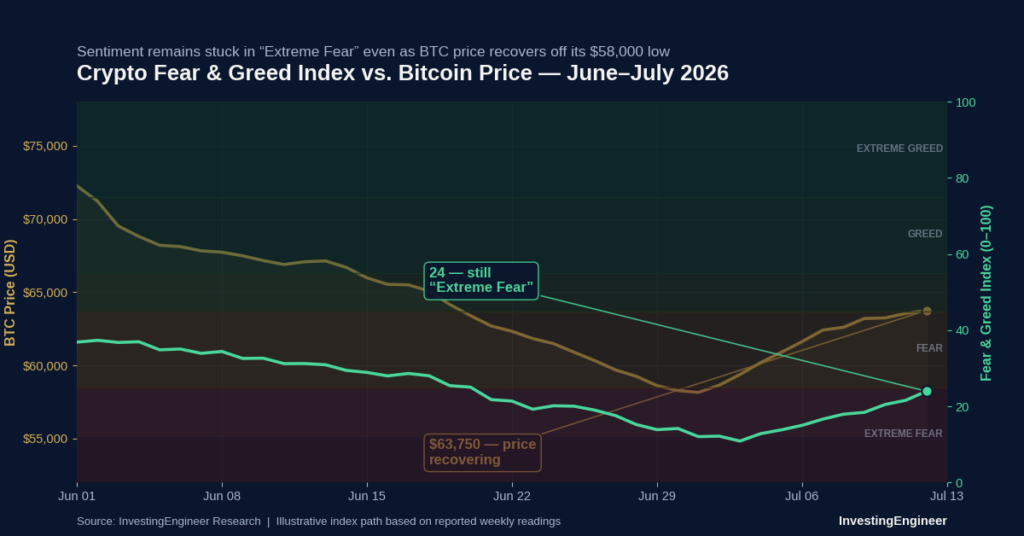
One of the more genuinely interesting signals this week is a disconnect between two different ways of measuring market mood. On one hand, whale wallets have been buying aggressively — that 270,000+ BTC accumulation move is a real, on-chain, verifiable fact. On the other hand, the Crypto Fear & Greed Index, a sentiment gauge that runs from 0 (Extreme Fear) to 100 (Extreme Greed) and pulls in data on volatility, momentum, social media activity, and more, remains stuck in “Extreme Fear” even as prices have recovered from their July 1 low.
What is whale accumulation?
“Whales” are wallets holding large amounts of a cryptocurrency — often the accounts of institutions, early investors, or very wealthy individuals. When these wallets add to their holdings during a price dip, as they have here, it’s generally read as a sign of long-term conviction, since large holders are typically better positioned to do research and ride out short-term volatility than the average retail trader.
What is the Crypto Fear & Greed Index?
It’s a composite score built from several inputs — price volatility, trading volume and momentum, social media sentiment, Bitcoin’s share of the total crypto market, and survey data — designed to capture the emotional temperature of the market in a single number. A reading in “Extreme Fear” generally means most participants are anxious and defensive, even if the price action doesn’t fully reflect that yet.
Why does this gap matter? It suggests the current bounce may be more mechanical — short-covering, ETF-driven buying, whales stepping in at a technical level — than the product of genuine, broad-based conviction that the worst is over. That’s not necessarily bearish on its own, but it does mean the rally could be more fragile than the price chart alone suggests, and more vulnerable to a sharp reversal if this week’s CPI or Fed testimony delivers a negative surprise.
Top 10 Cryptocurrencies to Watch This Week
Based on scheduled catalysts, institutional flows, on-chain activity, and market sentiment, here are the ten cryptocurrencies most likely to see meaningful price movement this week.
| Rank | Coin | Sector | Trend | Confidence | Primary Catalyst |
|---|---|---|---|---|---|
| 1 | Bitcoin (BTC) | Store of Value | Neutral-to-Bullish | 70% | June CPI + Warsh testimony (Jul 14-15) |
| 2 | Ethereum (ETH) | Smart Contracts | Neutral-to-Bullish | 60% | Testing $1,804 resistance |
| 3 | XRP | Payments | Bearish-to-Neutral | 50% | Futures deleveraging vs. steady ETF inflows |
| 4 | Solana (SOL) | Layer 1 | Neutral | 55% | On-chain strength vs. weak price action |
| 5 | Cardano (ADA) | Layer 1 | Bullish | 55% | 18% surge; 233 weekly code commits |
| 6 | Chainlink (LINK) | Infrastructure | Bullish | 55% | RWA growth + cross-chain adoption |
| 7 | Dogecoin (DOGE) | Payments/Meme | Neutral | 45% | Historical accumulation zone |
| 8 | Stellar (XLM) | RWA/Payments | Bullish | 45% | Top RWA settlement platform |
| 9 | Toncoin (TON) | Layer 1 | Neutral | 40% | Light unlock week; consumer adoption |
| 10 | Hyperliquid (HYPE) | DeFi/Derivatives | Neutral | 45% | On-chain derivatives market share |
Build a Watchlist for This Week’s Top 10 Cryptos
From Bitcoin and Ethereum to XRP, Cardano, and Friday’s monthly options expiry levels — track every coin on this week’s list in one place.
Set Up Your Watchlist on TradingView →XRP’s Split Personality: Futures Capitulation Meets Steady ETF Demand
XRP is this week’s most instructive example of how two different corners of the market can send opposite signals about the same asset. In the futures market — where traders use leverage to bet on price direction — XRP has seen real capitulation. Open interest, the total value of all outstanding futures contracts, has fallen from over $500 million in mid-June to under $400 million, and long liquidations (forced closures of bets that price would rise) jumped 94% week-over-week. That’s the signature of leveraged traders getting flushed out.
At the same time, spot XRP ETFs — regulated funds that let investors gain exposure without directly holding the token — have posted an eighth consecutive week of net inflows. That’s a much steadier, longer-horizon form of demand than futures positioning, and it points to a real split between short-term trading sentiment and longer-term institutional appetite. XRP has also underperformed on price, down roughly 20% over the past month to around $1.04–$1.10, partly because the CLARITY Act — a piece of legislation that would clarify how XRP and similar tokens are regulated — remains stalled in the Senate, still short of the 60 votes needed to advance.
For investors, the lesson is less about picking a direction for XRP specifically and more about recognizing that futures data and ETF flow data can disagree, and that both are worth checking before drawing conclusions about where “smart money” really stands.
The US–Iran Conflict and the Dollar: An Underappreciated Crypto Risk
It might seem like a stretch to connect a Middle East conflict to Bitcoin’s price, but the linkage runs through the US dollar and inflation expectations. Fresh American strikes on Iranian targets and Iranian retaliation against US bases pushed Brent crude oil up as much as 6% intraweek to near $78 a barrel before it eased to close at $76.01. The US Treasury’s waiver allowing continued purchases of Iranian oil is set to expire July 17, right inside this window, which could add fresh upward pressure on oil prices if enforcement tightens.
Here’s why that matters for crypto: rising oil prices feed directly into inflation, which is exactly the kind of data that could push Warsh toward a more hawkish tone in his testimony. Notably, gold and silver — the traditional safe havens investors might expect to rally on geopolitical conflict — actually fell last week, as hawkish Fed-related dollar strength outweighed any war-related safe-haven demand. Bitcoin’s own relationship with the dollar has reportedly flipped in recent years, moving more in line with (rather than opposite to) dollar strength as institutional adoption has grown. That makes this week a real test of that relationship: if the dollar strengthens further on hawkish Fed signals and oil-driven inflation fears, it’s not obvious that Bitcoin will be insulated the way some investors might assume.
Stablecoins in Focus: Circle’s New Bank Charter vs. a Rival Consortium
Away from Bitcoin and Ethereum, one of the more consequential developments of the past month has been playing out in the stablecoin market — the digital tokens like USDC and USDT that are pegged to the US dollar and used heavily for trading and payments. Circle, the issuer of USDC, just won final approval from the Office of the Comptroller of the Currency (OCC) to establish a national trust bank, a significant regulatory milestone that sent its stock surging as much as 16% in a single session. USDC has also pulled decisively ahead of Tether’s USDT in trading volume, now accounting for roughly 70% of a record $1.79 trillion in monthly adjusted stablecoin transaction volume.
But Circle’s position isn’t uncontested. A consortium of more than 140 companies — including Stripe, Coinbase, Visa, Mastercard, and BlackRock — has unveiled a rival stablecoin network called Open USD, a direct challenge that knocked Circle’s stock down sharply on the news. This competitive tension is unfolding just ahead of the GENIUS Act’s July 18 deadline (one day after this research window), when six federal agencies are due to finalize the rules that will govern how all stablecoin issuers operate going forward, including minimum capital requirements and reserve rules. Expect continued headlines on this front through the week as issuers position themselves ahead of that deadline.
Risks to Watch This Week
- A hot core CPI print combined with a hawkish tone from Warsh’s testimony is the single largest scheduled risk event of the week for crypto and other risk assets.
- The ETF inflow streak is only one confirmed week old for both Bitcoin and Ethereum; a reversal back to outflows would undercut the current bullish case.
- Warsh’s disclosed personal Bitcoin holdings make his testimony a genuine wildcard for crypto specifically, not just an ordinary macro event.
- Sentiment stuck in “Extreme Fear” even as prices recover raises the risk of a fast, sharp reversal if this week delivers a negative surprise.
- Strategy Inc.’s first disclosed Bitcoin sale this cycle, alongside similar trimming from Empery Digital, are early cracks in the “corporations never sell” narrative worth watching, without overstating their size.
- The unresolved US–Iran conflict and the July 17 oil-waiver expiration could still trigger a broader risk-off shock that crypto markets have so far avoided.
Key Takeaways
- Bitcoin closed at $63,019 last week, its second straight weekly gain; Ethereum closed at $1,795, testing key $1,804 resistance.
- June CPI (Tuesday, July 14, 8:30 a.m. ET) lands roughly 90 minutes before Fed Chair Kevin Warsh’s first House testimony; he testifies before the Senate the next day.
- Warsh has disclosed personal Bitcoin holdings, making his testimony an unusually direct crypto-specific event.
- US Bitcoin and Ethereum ETFs both turned net positive for the week ending July 10, ending an eight-week outflow streak for Ethereum.
- Whale wallets added over 270,000 BTC (~$16.7B) near $58,000–$59,000, even as sentiment stays in “Extreme Fear.”
- Strategy Inc. sold about 3,588 BTC in early July — its first disclosed sale this cycle.
- XRP shows a rare split: futures markets are deleveraging sharply while spot ETFs post an eighth straight week of inflows.
- Cardano surged 18% on strong development activity, reclaiming a top-15 market cap ranking.
- The US–Iran conflict and a July 17 oil-waiver expiration add a geopolitical layer of inflation risk this week.
- Circle won a national bank charter as a 140-company rival stablecoin consortium (Open USD) launched, ahead of the July 18 GENIUS Act deadline.
Frequently Asked Questions
When is June CPI released, and why does it matter for Bitcoin?
June CPI is released Tuesday, July 14, 2026, at 8:30 a.m. ET. It matters because the Federal Reserve uses inflation data to guide interest rate decisions, and interest rates influence how much money flows into or out of riskier assets like Bitcoin.
Why is Fed Chair Kevin Warsh’s testimony different from a typical Fed appearance?
Warsh has disclosed that he personally holds Bitcoin, making him the first Fed chair to have that kind of direct, disclosed exposure to the asset. Lawmakers are expected to question him specifically about bitcoin regulation, adding a crypto-specific dimension to what is normally a purely macroeconomic hearing.
Has Bitcoin’s ETF inflow streak been confirmed as a trend?
Not yet. The week ending July 10 was the first confirmed positive week for both Bitcoin and Ethereum ETFs after a rough stretch, but daily flows remain volatile, and a single hawkish surprise this week could reverse the trend.
Why is the Fear & Greed Index still showing “Extreme Fear” if prices are recovering?
Sentiment indexes lag behind price action and reflect a broader mix of factors, including volatility and social sentiment. The current gap suggests the recent bounce may be driven more by mechanical factors — like ETF flows and whale buying at technical levels — than by a genuine shift in overall market confidence.
What is whale accumulation, and is it a reliable signal?
Whale accumulation refers to large wallets adding to their holdings, often read as a sign of long-term conviction since large holders typically have more resources for research. It’s a useful data point, but it isn’t infallible — it should be weighed alongside sentiment, derivatives, and macro data rather than treated as a standalone buy signal.
How does the US–Iran conflict connect to crypto prices?
The connection runs through oil and inflation. Rising oil prices from the conflict could push inflation higher, which could influence the Fed toward a more hawkish stance — a scenario that has historically pressured risk assets, including crypto.
Is now a good time to buy Bitcoin or Ethereum?
This article is for informational and educational purposes only and isn’t personalized investment advice. Both bullish factors (ETF inflows, whale accumulation) and bearish factors (weak sentiment, macro risk) are present this week, so any decision should account for your own risk tolerance, time horizon, and research — ideally with the help of a licensed financial advisor.
Related Reading
Top 10 Asian Stocks to Watch This Week (July 6–10, 2026)
Top 10 UK Stocks to Watch This Week (July 6–10, 2026)
Top 10 US Stocks to Watch This Week (Jul 6–10, 2026)
Forex and Commodities to Watch This Week (July 6–10, 2026)
Crypto Market Outlook: Has Bitcoin Bottomed? (Jul 6–10, 2026)
Conclusion
Crypto markets head into the week of July 13–17, 2026 with a genuinely two-sided setup. Bitcoin and Ethereum’s two-week rebound is supported by real, verifiable data — improving ETF flows, heavy whale accumulation — but it’s happening against a backdrop of stubbornly weak sentiment, an early crack in corporate treasury conviction, and the year’s most concentrated cluster of macro risk events. June CPI and Fed Chair Kevin Warsh’s first congressional testimony, arriving within 90 minutes of each other on Tuesday, are likely to matter more for crypto prices this week than any single crypto-native headline. Add an unresolved US–Iran conflict and a shifting stablecoin competitive landscape, and this is a week where paying attention to the macro calendar is just as important as watching the charts.
Track These Levels in Real Time
With Bitcoin, Ethereum, and several altcoins sitting at key technical levels heading into a heavy macro week, having the right charting tools matters. TradingView offers free, real-time charts, customizable watchlists, and screener tools that let you track Bitcoin’s $62,000–$68,000 range, Ethereum’s $1,804 resistance level, and the rest of this week’s top movers as the data comes in.
Disclosure: The content on this page was produced with AI writing assistance under the editorial direction of a licensed Electrical Engineering practitioner and certified investor in different markets with over a decade of experience. All articles are reviewed and approved by the author before publication.
